UNITED STATES
SECURITIES AND EXCHANGE COMMISSION
WASHINGTON, D.C. 20549
FORM 10-K
ANNUAL REPORT PURSUANT TO SECTION 13 OR 15(d) OF THE
SECURITIES EXCHANGE ACT OF 1934
| For the fiscal year ended December 29, 2007 | Commission file number 0-21835 |
SUN HYDRAULICS CORPORATION
(Exact Name of Registration as Specified in its Charter)
| Florida | 59-2754337 | |
| (State or Other Jurisdiction of Incorporation or Organization) |
(I.R.S. Employer Identification No.) |
| 1500 West University Parkway Sarasota, Florida |
34243 | |
| (Address of Principal Executive Offices) | (Zip Code) |
941/362-1200
(Registrant’s Telephone Number, Including Area Code)
Securities registered pursuant to Section 12(b) of the Act
| Title of Each Class | Name of each exchange on which registered | |
| Common Stock $.001 Par Value | NASDAQ Stock Market, LLC |
Securities registered pursuant to Section 12(g) of the Act: None
Indicate by check mark if the registrant is a well-known seasoned issuer, as defined in Rule 405 of the Securities Act. Yes ¨ No x
Indicate by check mark if the registrant is not required to file reports pursuant to Section 13 or Section 15(d) of the Exchange Act. Yes ¨ No x
Indicate by check mark whether the Registrant (1) has filed all reports required to be filed by Section 13 or 15(d) of the Securities Exchange Act of 1934 during the preceding 12 months (or for such shorter period that the Registrant was required to file such reports), and (2) has been subject to such filing requirements for the past 90 days. Yes x No ¨
Indicate by check mark if disclosure of delinquent filers pursuant to Item 405 of Regulation S-K is not contained herein, and will not be contained, to the best of Registrant’s knowledge, in definitive proxy or information statements incorporated by reference in Part III of this Form 10-K or any amendment to this Form 10-K. ¨
Indicate by check mark whether the registrant is a large accelerated filer, an accelerated filer, or a non-accelerated filer. See definition of “accelerated filer and large accelerated filer” in Rule 12b-2 of the Exchange Act. (Check one):
Large accelerated filer ¨ Accelerated filer x Non-accelerated filer ¨
Indicate by check mark whether the registrant is a shell company (as defined in Rule 12b-2 of the Exchange Act). Yes ¨ No x
The aggregate market value of the shares of voting common stock held by non-affiliates of the Registrant, computed by reference to the closing sales price of such shares on the Nasdaq Stock Market, LLC, as of the last business day of the Registrant’s most recently completed second fiscal quarter was $377,777,319.
As of February 29, 2008, there were 16,572,552 shares of common stock outstanding.
PART I
| ITEM 1. | BUSINESS |
Overview
The Company is a leading designer and manufacturer of high-performance screw-in hydraulic cartridge valves and manifolds, which control force, speed, and motion as integral components in fluid power systems. The innovative floating construction of the Company’s screw-in cartridge valves and the design of the cavities in which they are installed provide demonstrable performance and reliability advantages compared to other available screw-in cartridge valves. The Company designs and manufactures one of the most comprehensive lines of screw-in hydraulic cartridge valves and manifolds in the world. The Company has generated a profit every year since 1972 and has paid a dividend every quarter since its initial public offering of securities in 1997. The Company believes that its success is primarily a result of its innovative product design, consistent high quality, superior product performance and the breadth of the markets it serves.
The Company sells its products primarily through a global network of independent fluid power distributors to a diverse universe of end users, for use in various “mobile” applications, such as construction, agricultural and utility equipment (historically, approximately 66% of net sales), and a broad array of “industrial” applications, such as machine tools and material handling equipment (historically, approximately 34% of net sales). While many of the Company’s end users are subject to cyclical demand for their products, the Company mitigates this exposure through the wide variety of applications and industries it serves. In 2007, sales to the Company’s largest distributor represented less than 7% of net sales, and approximately 58% of the Company’s net consolidated sales were outside the United States.
The Company was organized as a Florida corporation in 1986 to take over the operations of the business of the Company’s predecessor, Suninco, Inc. (f/k/a Sun Hydraulics Corporation). Suninco, Inc. was founded in 1970 by Robert E. Koski for the specific purpose of developing and promoting screw-in cartridge valve technology. The Company’s executive offices are located at 1500 West University Parkway, Sarasota, Florida 34243, and its telephone number is (941) 362-1200. The Company’s website is www.sunhydraulics.com.
Industry Background
Fluid power is one of three basic technologies, along with electrical and mechanical, utilized to achieve power transmission and motion control. Due to its mechanical advantage, fluid power is widely employed to move and position materials, control machines, vehicles and equipment, and improve industrial efficiency and productivity. Fluid power can perform work on very light loads with a high degree of accuracy or develop enormous forces to move and position materials and equipment that weigh many tons.
Screw-in hydraulic cartridge valves first appeared in the late 1950s as an alternative to conventional forms of hydraulic valves. Conventional hydraulic valves are generally larger in size, typically manufactured from cumbersome iron castings, relatively limited in their ability to interface with machinery and equipment, and are usually simple devices designed to control a single task. Screw-in cartridge valves represent a miniaturization of hydraulic valves, providing the same functional characteristics as conventional valves, but in a smaller package size. In addition to being lighter-weight and more compact, screw-in cartridge valves frequently offer significant advantages in interface flexibility and cost over conventional hydraulic valves.
Screw-in cartridge valves have significant marketplace acceptance because hydraulic system design engineers are easily able to develop multiple-function control systems. A number of screw-in cartridge valves can be grouped together in a manifold, creating a hydraulic control system that is functionally analogous to an electronic integrated circuit. End users can utilize screw-in cartridge valves and custom manifolds to design an optimal solution for control of their fluid power systems that significantly reduces assembly time and expense.
2
Strategy
The Company will continue to design, manufacture, market and support, on a worldwide basis, differentiated high-performance and high-quality cartridge valves and integrated valve packages. The Company believes this focus supports its business objectives of sustaining revenue growth that will yield an above-average return on capital while achieving a high level of customer satisfaction. Key elements of the Company’s strategy include the following:
Deliver Value Through High-Quality, High-Performance Products. The Company’s products are designed with operating and performance characteristics that exceed those of many functionally similar products. Overall, the Company’s products provide high value because they generally operate at higher flow rates and pressures than competitive offerings of the same size. The Company tests 100% of its screw-in cartridge valves to ensure the highest level of performance on a consistent basis.
Achieve a High Level of Customer Satisfaction. The Company is a build-to-order operation that schedules orders to the customer’s request date. To ensure all employees are dedicated to meeting customer requests, the Company measures and posts monthly the percentage of shipments that satisfy the customers’ requests. In addition to meeting the above requirement, the Company tests 100% of the screw-in cartridge valves before shipment. The Company tests extensively all product returns due to questions regarding functionality and issues a written report of findings upon request. The Company believes that its long-term success is dependent upon its reputation in the marketplace, which in turn is a result of its ability to service its customers.
Offer a Wide Variety of Standard Products. The Company currently offers one of the most comprehensive lines of screw-in cartridge valves and manifolds in the world. The Company is committed to producing functionally superior, standard products that contain a high degree of common content to minimize work in process and maximize manufacturing efficiency. Products are designed for use by a broad base of industries to minimize the risk of dependence on any single market segment or customer. The Company expands its business through the development of new products that are complementary to its existing products.
Expand the Product Line. The Company is continuously engaged in new product development programs to offer new and better cartridge valve solutions to its customers. New cartridge products generally fit into existing cavities, often allowing them to be installed in existing standard manifolds. The Company recently has aggressively begun designing and introducing to the marketplace electro-hydraulic cartridge valves, including solenoid and proportional valves. The Company believes these products provide the opportunity to obtain sales for which it previously could not compete, and further believes that the electro-hydraulic cartridge valves will help increase sales of the Company’s other cartridge valve and manifold products.
Capitalize on Custom Manifold Opportunities. Because fluid power system design engineers are increasingly incorporating screw-in cartridge valves into custom control systems, the Company concentrates its efforts in custom manifolds in two ways. The Company designs and manufactures manifolds which incorporate the Company’s screw-in cartridge valves for sale to original equipment manufacturers (“OEMs”). To support this effort, the Company is able to design and manufacture manifolds at its operations in Sarasota, Florida and Kansas City, Kansas, USA, Coventry, England, Erkelenz, Germany, Seoul, Korea and at its operation in Shanghai, China. The Company also encourages competitive manifold manufacturers to utilize the Company’s screw-in cartridge valves in their manifold designs. The Company sells tooling for machining its cavities, allowing independent manifold manufacturers to easily incorporate the Company’s screw-in cartridge valves into their designs.
Expand Global Presence. The Company intends to continue to strengthen its global presence in the areas of distribution and international operations. The Company has strong distributor representation in most developed and developing markets, including North and South America, Western Europe, Asia, Australia, and South Africa. In 2007, the Company generated approximately 58% of its net sales outside the United States. The Company is continuing to expand its distribution arrangements in Eastern Europe and expand its market presence in China, Central and South America. The Company believes that further expansion of its international facilities will enhance its competitive position in certain foreign markets. In addition, custom manifolds provide an opportunity for operating units and distributors to offer significant value-added content through the local production of manifolds that incorporate the Company’s screw-in cartridge valves. This strategy helps minimize potential tariffs and duties that could inflate the price of the Company’s products in foreign markets.
3
Maintain a Horizontal Organization with Entrepreneurial Spirit. The Company believes that maintaining its horizontal management structure is critical to retaining key personnel and an important factor in attracting top talent from within the hydraulic valve and manifold industry. The Company strives to maintain its horizontal management structure that encourages communication, creativity, entrepreneurial spirit, and individual responsibility among employees. Employee initiatives have led to continuous process improvements, resulting in considerable operating efficiencies and quality control, as well as the maintenance of a safe and comfortable working environment. The Company believes that a lack of job titles and direct formal reporting responsibilities eliminates perceived barriers to advancement and reduces the potential for adversarial relationships to arise within the organization. A workplace without walls in the Company’s offices as well as on the shop floor encourages informal employee consultation and provides the opportunity for all personnel to interface across functional areas.
Leverage Manufacturing Capability and Know-how as Competitive Advantages. The Company believes that one of its competitive advantages is its ability to consistently manufacture products to demanding specifications. The Company’s strong process capability is critical in achieving the high performance characteristics of its screw-in cartridge valves. The Company has the ability to manufacture most of the components of its products with the exception of springs, elastomer seals, and electrical coils, although most high-volume machining is performed by independent, outside vendors (see Manufacturing). The Company has in-house heat treatment capability to provide consistent and reliable control of this critical operation.
Sell Through Distributors. Due to the variety of potential customers and the Company’s desire to avoid unnecessary bureaucracy, the sales function has been performed primarily by independent distributors. The Company has 72 distributors, 51 of which are located outside the United States, and a majority of which have strong technical backgrounds or capabilities, which enable them to develop practical, efficient and cost-effective fluid power systems for their customers. Many of these distributors sell products manufactured by other companies that allow them to provide a complete hydraulic system to the customer. The Company provides a high level of technical support to its distributors through open access to the Company’s engineering staff, technical documentation, and technical training programs.
Develop Closer Relations with Key Customers. The Company maintains close relationships with many OEMs and end users of its products to help it understand and predict future needs for fluid power control devices and to test and refine new product offerings. The Company also recognizes it will sometimes have to develop a direct relationship in the areas of sales and support with some large OEMs that are existing or potential customers. The Company will be selective in developing these relationships and believes the closer ties will help increase sales without compromising profits or developing excessive bureaucracy.
Brand Label and License Manufacturing where desirable. When it is deemed to be of strategic benefit, the Company sometimes enters into marketing, brand labeling and/or non-exclusive manufacturing licensing agreements with other manufacturers of fluid power components. Historically, approximately 5% of the Company’s sales have been to other fluid power manufacturers that incorporate the Company’s products into complete system solutions.
Seek Complementary Strategic Partnerships/Alliances/Investments. As the machinery the Company’s products are used in becomes more integrated, hydraulics control systems are required to integrate and communicate with other machine systems. Increasingly in the future the Company expects to expand its internally developed products and capabilities via investments in outside firms. These investments could be full acquisitions, joint ventures, partial ownership investments, similar to past equity investments in WhiteOak Controls, Inc. and High Country Tek, Inc., or other alliances that would enhance the Company’s service and product offering.
Pursue Complete Control System Solutions. Historically, the Company’s products have been purchased as components that have been used with other components not of the Company’s manufacture to make a hydraulic control system. The Company is now more often engaged in developing complete packaged system solutions that integrate more fully with OEMs’ machinery. This is consistent with other strategies mentioned above including Capitalizing on Custom Manifold Opportunities, Develop(ing) Closer Relations with Key Customers and Seek(ing) complementary strategic partnerships/alliances/investments.
4
Products
Screw-in Cartridge Valves
The Company designs and manufactures high-performance, screw-in hydraulic cartridge valves in five size ranges, suitable for flows from one to 400 gallons per minute and continuous operating pressures up to 5,000 pounds per square inch. The floating construction pioneered by the Company provides demonstrable performance and reliability advantages compared to most competitors’ product offerings due to its self-alignment characteristic that accommodates potential manufacturing deviations common in the thread-making operations of screw-in cartridge valves and manifolds. This floating construction differentiates the Company from most of its competitors, which design and manufacture rigid screw-in cartridge valves that fit an industry common cavity. The floating construction of the Company’s screw-in cartridge valves eliminates the tendency of working parts inside the cartridge valves to bind when screwed into the manifold, which leads to unnecessary stress and, often, premature failure. Some competitors manufacture products that fit the Company’s cavity. Strategically, the Company believes the markets for its products will expand more rapidly if other sources are available for products that fit the Company’s cavity.
Electrically actuated hydraulic cartridges
In recent years the Company has developed and released to the marketplace a broad range of electrically actuated hydraulic cartridge valves. These valves, while commonly available in the industry for more than 30 years, are a relatively recent addition to the Company’s product line. The Company’s electrically actuated hydraulic valves are differentiated from competitive products in the same ways the Company’s pure hydraulic valves are, namely performance, pressure rating, size relative to capacity, reliability and broad range of options.
Manifolds
A manifold is a solid block of metal, usually aluminum or ductile iron, which is machined to create threaded cavities and channels into which screw-in cartridge valves can be installed and through which the hydraulic fluid flows. The manifolds manufactured by the Company are described below:
Standard Manifolds. The variety of standard, catalogued manifolds offered by the Company is unmatched by any screw-in cartridge valve or manifold competitor. These products allow customers to easily integrate the Company’s screw-in cartridge valves into their systems in many different ways. Once designed, standard manifolds require minimal, if any, maintenance engineering over the life of the product and can be readily manufactured at all of the Company’s operations.
Custom Manifolds. Custom manifolds are designed for a customer-specific application and typically combine many different screw-in cartridge valves in a single package or multiple packages. The Company’s internally-developed, proprietary expert system software allows the Company to manufacture manifolds efficiently in low volumes. The innovative design of the Company’s screw-in cartridge valves allows manifolds to be physically smaller for certain applications than functionally similar manifolds containing competitors’ screw-in cartridges that fit industry common cavities. The Company believes many of the custom manifolds that incorporate cartridge valves which fit industry common cavities require testing after assembly. The Company does not routinely test manifolds that contain its screw-in cartridge valves because of the inherent reliability of the cartridge valves, and this provides the Company with a significant competitive advantage. Custom manifolds provide many benefits to end users and equipment manufacturers, including reduced assembly time, order simplification, reduced leakage points, neater packaging, potentially fewer hose and fitting connections, and more control functions in a single location.
Integrated Packages
An integrated package is an assembly of cartridge valves into a custom designed manifold. In recent years, with the proliferation of more electrically actuated hydraulic cartridges, the Company has altered its approach to supplying fully assembled integrated packages. Previously, the Company designed and manufactured custom manifolds but routinely shipped the manifolds and cartridges separately, leaving the assembly task to either the distributor or the customer. This approach resulted from the Company’s
5
inability, in the past, to supply the electrically actuated hydraulic valve content of the circuit. As the Company has expanded its offerings of electrically actuated hydraulic products, it is now able to provide most of the functionality required in the marketplace. Therefore, the Company now ships fully assembled integrated packages, often direct to the customer. Due to the inherent service advantage for all parties, this approach has helped make the Company more attractive as an integrated package and system supplier.
Engineering
The Company’s engineers play an important role in all aspects of the Company’s business, including design, manufacturing, sales and marketing and technical support. When designing products, engineers work within a disciplined set of design parameters that often results in repeated incorporation of existing screw-in cartridge valve parts in new functional products.
During product development, engineers work closely with manufacturing personnel to define the processes required to manufacture the product reliably and consistently. The close link between engineering and manufacturing helps smooth the transition from design to market. Design changes to facilitate manufacturing processes are sometimes considered but typically not if product performance levels would be compromised. The Company practices a continuous improvement process, which it believes is largely attributable to its horizontal management structure that empowers employees and encourages their creative contribution. At various times the Company may incorporate design changes in a product to improve its performance or life expectancy. All of the Company’s engineers provide application support to customers and distributors.
Manufacturing
The Company is a process intensive manufacturing operation that extensively utilizes computer numerically controlled (“CNC”) machinery to manufacture its products. Where commercial machinery is not available for specific manufacturing or assembly operations, the Company often designs and builds its own machinery to perform these tasks. The Company makes extensive use of automated handling and assembly technology (including robotics) where possible to perform repetitive tasks, thus promoting manufacturing efficiencies and workplace safety. The Company has its own electric heat treatment furnaces to provide consistent and reliable control of this important operation.
At its two Sarasota, Florida, manufacturing plants, the Company has extensive testing facilities that allow its design engineers to test fully all cartridge valve products at their maximum rated pressure and flow rates. A metallurgist and complete metallurgical laboratory support the Company’s design engineers and in-house heat treatment. The resident engineers at the Company’s other facilities also utilize test equipment.
The Company employs a build-to-order philosophy and relies on its distributors to purchase and maintain sufficient inventory to meet their customers’ demands. With this build-to-order philosophy, most raw materials, including aluminum and steel, are delivered on a just-in-time basis. These and other raw materials are commercially available from multiple sources.
The Company controls most critical finishing processes in-house but does rely on a small network of outside manufacturers to machine cartridge parts to varying degrees of completeness. Many high-volume machining operations are performed exclusively at outside suppliers. The Company is very selective in establishing its supplier base and attempts to develop and maintain long-term relationships with suppliers. The Company continually reviews all of its suppliers to improve the quality of incoming parts and to assess opportunities for better control of both price and quality. The Company’s quality systems at the U.S. and U.K. facilities are in compliance with ISO 9001:2000 for design and manufacture of steel cartridge valves, aluminum and ferrous manifolds for hydraulic systems. Those in Korea are certified to ISO 9001:2000 and 14001:2004 for the design, development, production, and after sales service of hydraulic valves.
Sales and Marketing
The Company’s products are sold globally, primarily through independent fluid power distributors. Distributors are supported with product education programs conducted by the Company at its facilities. Technical support is provided by each of the Company’s operations (Florida, Kansas, England, Germany, France, Korea, India and China). Included in the Company’s sales and marketing staff are hydraulic
6
engineers who have significant experience in the fluid power industry. Discount pricing structures encourage distributors to buy in moderate to high volumes to ensure there is a local inventory of products in the marketplace.
The Company currently has 72 distributors, 51 of which are located outside the United States and a majority of which have strong technical backgrounds or capabilities, which enable them to develop practical, efficient, and cost-effective fluid power systems for their customers. In 2007, sales to the Company’s largest distributor represented less than 7% of net sales and net sales outside of the United States represented approximately 58% of total net sales.
In addition to distributors, the Company sells directly to other companies within the hydraulic industry under a pricing program that does not undermine the primary distributors’ efforts. Companies that participate in this program utilize the Company’s products in a value-added application, integrating the Company’s screw-in cartridge valves into other fluid power products or systems of their manufacture. Management believes this strategy strengthens the Company by encouraging other manufacturers to buy products from the Company that they might otherwise develop themselves.
The Company has in the past, to a limited degree, sold product directly to OEMs. Although the Company does not have any employee whose primary responsibility is direct sales, it may consider this in the future. The Company recognizes that to gain access to certain large OEM accounts it may have to deal directly in the areas of sales and support.
While the Company principally sells its products through distributors, it provides end users with technical information via its website and catalogues that offer design engineers all of the information necessary to specify and obtain the Company’s products. The Company believes that providing complete technical information to the marketplace helps to stimulate demand for the Company’s products. The Company’s website continues to evolve and has helped to reduce the time between engineering release of products and their appearance in the marketplace. The Company is continuing to invest in this technology as one of the best ways to keep its broad product offering available to customers around the world.
Customers
While many of the Company’s customers’ requirements are growing, management does not believe that the loss of any one customer would have a material adverse effect on the Company’s business. End-user customers are classified by whether their primary applications for the Company’s products are “mobile” or “industrial.”
Mobile applications involve equipment that generally is not fixed in place and is often operated in an uncontrolled environment, such as construction, agricultural, mining, and fire and rescue and other utility equipment. Mobile customers were the original users of screw-in cartridge valves due to the premium that these industries place on considerations of space, weight, and cost. Mobile customers historically account for approximately 66% of the Company’s net sales.
Industrial applications involve equipment that generally is fixed in place in a controlled environment. Examples include automation machinery, presses, plastics machinery such as injection molding equipment, and machine tools. The requirements of the industrial marketplace are more demanding than most mobile applications since industrial equipment typically operates at significantly higher cycles. The Company’s products are designed to withstand these operating imperatives, and industrial applications historically account for approximately 34% of the Company’s net sales. Many conventional valve designs are still used in industrial applications and represent substitution opportunities for the Company’s products.
In recent years, new applications have emerged that do not fit conveniently into the mobile or industrial category, often blending requirements of each. Some of these applications include animatronics, wind power, wave power, solar power and amusement park rides. The Company expects to continue to see new application areas outside of traditional mobile or industrial markets.
The Company does not warrant its products for use in any of the following applications, (i) any product that comes under the Federal Highway Safety Act, such as steering or braking systems for passenger-carrying vehicles or on-highway trucks, (ii) aircraft or space vehicles, (iii) ordnance equipment, (iv) life
7
support equipment, and (v) any product that, when sold, would be subject to the rules and regulations of the United States Nuclear Regulatory Commission. These “application limitations” have alleviated the need for the Company to maintain the internal bureaucracy necessary to conduct business in these market segments.
Competition
The hydraulic valve industry is highly fragmented and intensely competitive. The Company’s competitors, include full-line producers and niche suppliers, more similar to the Company. Most competitors market globally. Full-line producers have the ability to provide total hydraulic systems to customers, including components functionally similar to those manufactured by the Company. There has been increasing consolidation activity within the industry in recent years, with large, full-line producers filling out their product lines by acquiring or entering into relationships with other hydraulics companies, and management expects there will be further consolidation in the future. The Company believes that it competes based upon quality, reliability, price, value, speed of delivery and technological characteristics.
Most of the Company’s screw-in cartridge valve competitors produce screw-in cartridge valves that fit an industry common cavity that sometimes allows their products to be interchangeable. The industry common cavity is not currently supported by any national or global standards organizations, although there is an ongoing effort to standardize a modified version of this cavity in the United States. The International Standards Organization (ISO) has developed a standard screw-in cartridge cavity that is different from the industry common cavity, but the Company is not aware of any major competitor that currently produces a full line of standard products conforming to the ISO standard. The Company does not manufacture a product that fits either the industry common or the ISO standard cavity. Some competitors manufacture selected screw-in cartridge valves that fit the Company’s cavity. The Company believes the majority of these products are load control valves. Management believes that increased use of the Company’s cavity will be beneficial in the long term because, although competition will increase, markets and applications for the Company’s products also will increase.
Employees
As of December 29, 2007, the Company had 689 full-time employees in the United States, 81 in England, 37 in Germany, three in France and 41 in Korea. The Company continues to focus its efforts on designing and manufacturing products with broad market place appeal, allowing it to maintain over 90% of its employees in manufacturing, distribution, and engineering functions. No employees are represented by a union in any of the Company’s operating units, and management believes that relations with its employees are good. Employees are paid either hourly or with an annual salary at rates that are competitive with other companies in the industry and in its geographic areas. Management believes that the combination of competitive salary, above average health and retirement plans, and a safe and pleasant working environment discourages employee turnover and encourages efficient, high-quality production. Nevertheless, due to the nature of the Company’s manufacturing business, it is sometimes difficult to attract skilled personnel.
Patents and Trademarks
The Company believes that the growth of its business is dependent upon the quality and functional performance of its products and its relationship with the marketplace, rather than the extent of its patents and trademarks. The Company’s principal trademark is registered internationally in the following countries: Argentina, Australia, Brazil, Canada, Chile, China, France, Germany, India, Italy, Japan, Korea, Mexico, Peru, Spain, Sweden, Switzerland, the United Kingdom and the United States. While the Company believes that its patents have significant value, the loss of any single patent would not have a material adverse effect on the Company.
Available Information
The Company’s annual report on Form 10-K, quarterly reports on Form 10-Q, current reports on Form 8-K, and amendments to those reports, as well as its proxy statements and other materials which are filed with or furnished to the Securities and Exchange Commission (“SEC”) are made available, free of charge, on or through its website under the heading “Investor Relations - Reports - SEC Filings,” as soon as reasonably practicable after they are filed with, or furnished to, the SEC.
8
ITEM 1A. - RISK FACTORS
FACTORS INFLUENCING FUTURE RESULTS—FORWARD-LOOKING STATEMENTS
This Annual Report contains “forward-looking statements” (within the meaning of the Private Securities Litigation Reform Act of 1995) that are based on current expectations, estimates, forecasts, and projections about us, our beliefs, and assumptions made by us, including (i) our strategies regarding growth, including our intention to develop new products; (ii) our financing plans; (iii) trends affecting our financial condition or results of operations; (iv) our ability to continue to control costs and to meet our liquidity and other financing needs; (v) the declaration and payment of dividends; and (vi) our ability to respond to changes in customer demand domestically and internationally, including as a result of standardization. In addition, we may make other written or oral statements, which constitute forward-looking statements, from time to time. Words such as “may,” “expects,” “projects,” “anticipates,” “intends,” “plans,” “believes,” “seeks,” “estimates,” variations of such words, and similar expressions are intended to identify such forward-looking statements. Similarly, statements that describe our future plans, objectives or goals also are forward-looking statements. These statements are not guarantees of future performance and are subject to a number of risks and uncertainties, including those discussed below and elsewhere in this report. Our actual results may differ materially from what is expressed or forecasted in such forward-looking statements, and undue reliance should not be placed on such statements. All forward-looking statements are made as of the date hereof, and we undertake no obligation to update any forward-looking statements, whether as a result of new information, future events or otherwise.
Factors that could cause actual results to differ materially from what is expressed or forecasted in such forward-looking statements include, but are not limited to: (i) conditions in the capital markets, including the interest rate environment and the availability of capital; (ii) changes in the competitive marketplace that could affect our revenue and/or cost bases, such as increased competition, lack of qualified engineering, marketing, management or other personnel, and increased labor and raw materials costs; (iii) new product introductions, product sales mix and the geographic mix of sales nationally and internationally; and the following risk factors:
Sales in our industry are subject to economic cycles. The capital goods industry in general, and the hydraulic valve and manifold industry in particular, are subject to economic cycles, which directly affect customer orders, lead times and sales volume. The downturn in the industry from 2001—2003 had a material adverse effect on our business and results of operations. The strength of the economic recovery which began in 2004 directly affected orders for our products through 2007. The continued strength or a weakening in the economy in the future will directly affect future orders.
Our products are subject to obsolescence due to technological change. The fluid power industry and its component parts are subject to technological change, evolving industry standards, changing customer requirements and improvements in and expansion of product offerings. If technologies or standards used in our products become obsolete, our business, financial condition and results of operations will be adversely affected. Although we believe that we have the technological capabilities to remain competitive, we cannot assure you that developments by others will not render our products or technologies obsolete or noncompetitive. See “Item 1. - Business — Strategy.”
We are subject to intense competition. The hydraulic valve industry is highly fragmented and intensely competitive, and we face competition from a large number of competitors, some of which are full-line producers and others that are niche suppliers like us. Full-line producers have the ability to provide total hydraulic systems to customers, including components functionally similar to those manufactured by us. We believe that we compete based upon quality, reliability, price, value, speed of delivery and technological characteristics. Many of our screw-in cartridge valve competitors are owned by corporations that are significantly larger than us and have greater financial resources than we do. We cannot assure you that we will continue to be able to compete effectively with these companies.
The manifold business is also highly fragmented and intensely competitive. All of the major screw-in cartridge valve manufacturers either manufacture manifolds or have sources that they use on a regular basis. In addition, there are a number of independent manifold suppliers that produce manifolds incorporating various manufacturers’ screw-in cartridge valves, including those made by us. Finally, there
9
are many small, independent machine shops that produce manifolds at very competitive prices. We believe that competition in the manifold business is based upon quality, price, proximity to the customer and speed of delivery. Many of our competitors have very low overhead structures and we cannot assure you that we will continue to be able to compete effectively with these companies.
In addition, we compete in the sale of hydraulic valves and manifolds with certain of our customers. Generally, these customers purchase cartridge valves from us to meet a specific need in a system that cannot be filled by any valve made by such customer. To the extent that we introduce new valves in the future that increase the competition between us and such customers, such competition could adversely affect our relationships with these customers.
The marketplace could adopt an industry standard cavity that would not accommodate our products. Our screw-in cartridge valves fit into a unique cavity for which, to date, few other manufacturers have designed products. Accordingly, our screw-in cartridge valves are not interchangeable with those of other manufacturers. Most competitive manufacturers produce screw-in cartridge valves that fit into an industry common cavity. There is an ongoing effort in the United States to produce a new standard for screw-in hydraulic cartridge valve cavities based on the industry common cavity. Additionally, the International Standards Organization (“ISO”) has an existing industry standard for screw-in hydraulic cartridge valve cavities, which is different from our cavity and the industry common cavity. In our view, the industry common cavity as well as the suggested standardized form of this cavity and the ISO standard cavity fail to address critical functional requirements, which could result in performance and safety problems of significant magnitude for end users. To our knowledge, no major competitor has converted its standard product line to fit the ISO standard cavity. Any move by a substantial number of screw-in cartridge valve and manifold manufacturers toward the adoption of ISO standard or another standard, based on the existing industry common cavity, could have a material adverse effect on our business, financial condition and results of operation. See “Item 1. - Business — Competition.”
We are subject to risks relating to international sales. In 2007, approximately 58% of our net sales were outside of the United States. We are expanding the scope of our operations outside the United States, both through direct investment and distribution, and expect that international sales will continue to account for a substantial portion of our net sales in future periods. International sales are subject to various risks, including unexpected changes in regulatory requirements and tariffs, longer payment cycles, difficulties in receivable collections, potentially adverse tax consequences, trade or currency restrictions, and, particularly in emerging economies, potential political and economic instability and regional conflicts. Furthermore, our international operations generate sales in a number of foreign currencies, particularly British pounds, the Euro, and the Korean Won. Therefore, our financial condition and results of operation are affected by fluctuations in exchange rates between the United States dollar and these currencies. Any or all of these factors could have a material adverse effect on our business, financial condition and results of operations.
We are subject to various risks relating to our growth strategy. In pursuing our growth strategy, we intend to expand our presence in our existing markets and enter new markets. In addition, we may pursue acquisitions and joint ventures to complement our business. Many of the expenses arising from our expansion efforts may have a negative effect on operating results until such time, if at all, that these expenses are offset by increased revenues. We cannot assure you that we will be able to improve our market share or profitability, recover our expenditures, or successfully implement our growth strategy. See “Item 1. - Business — Strategy.”
Our expansion strategy also may require substantial capital investment for the construction of new facilities and their effective operation. We may finance the acquisition of additional assets using cash from operations, bank or institutional borrowings, or through the issuance of debt or equity securities. We cannot assure you that we will be able to obtain financing from bank or institutional sources or through the equity or debt markets or that, if available, such financing will be on terms acceptable to us.
We are dependent upon key employees and skilled personnel. Our success depends, to a significant extent, upon a number of key individuals. The loss of the services of one or more of these individuals could have a material adverse effect on our business. Our future operating results depend to a significant
10
degree upon the continued contribution of our key technical personnel and skilled labor force. Competition for management and engineering personnel is intense, and we compete for qualified personnel with numerous other employers, some of which have greater financial and other resources than we do. We conduct a substantial part of our operations at our facilities in Sarasota, Florida. Our continued success depends on our ability to attract and retain a skilled labor force at this location. While we have been successful in attracting and retaining skilled employees in the past, we cannot assure you that we will continue to be successful in attracting and retaining the personnel we require to develop, manufacture and market our products and expand our operations. See “Item 1. - Business — Employees.”
We are subject to the risk of liability for defective products. The application of many of our products entails an inherent risk of product liability. We cannot assure you that we will not face any material product liability claims in the future or that the product liability insurance we maintain at such time will be adequate to cover such claims.
We are subject to fluctuations in the prices of raw materials. The primary raw materials used in the manufacture of our products are aluminum, ductile iron and steel. We cannot assure you that prices for such materials will not increase or, if they do, that we will be able to increase the prices for our products to maintain our profit margins. Material costs have increased during the past fiscal year. These costs increases were partially offset by sales price increases in January and July of this year. If future price increases do not adequately cover material cost increases, our operating results may be adversely affected.
We are dependent upon our parts suppliers. Our largest expense in the cost of sales is purchased cartridge valve parts. We cannot assure you that our manufacturing costs and output would not be materially and adversely affected by operational or financial difficulties experienced by one or more of our suppliers.
Hurricanes could cause a disruption in our operations which could adversely affect our business, results of operations, and financial condition. A significant portion of our operations are located in Florida, a region that is susceptible to hurricanes. Such weather events can cause disruption to our operations and could have a material adverse effect on our overall results of operations. While we have property insurance to partially reimburse us for wind losses resulting from a named storm, such insurance would not cover all possible losses.
We are subject to the cost of environmental compliance and the risk of failing to comply with environmental laws. Our operations involve the handling and use of substances that are subject to federal, state and local environmental laws and regulations that impose limitations on the discharge of pollutants into the soil, air and water and establish standards for their storage and disposal. We believe that our current operations are in substantial compliance with applicable environmental laws and regulations, the violation of which could have a material adverse effect on our business, financial condition and results of operations. New laws and regulations, or stricter interpretations of existing laws or regulations, could have a material adverse affect on our business, financial condition and results of operations.
Our board may decide to reduce or eliminate dividends. Although we have paid a cash dividend each quarter since our common stock began trading in 1997, we cannot assure you that funds will be available for this purpose in the future. The declaration and payment of dividends is subject to the sole discretion of our board of directors and will depend upon our profitability, financial condition, capital needs, future prospects and other factors deemed relevant by the board, and may be restricted by the terms of credit agreements that we may enter into.
Certain anti-takeover provisions may hinder or prevent a change in control. Our Articles of Incorporation provide for a classified board of directors. In addition, the Articles give the board of directors the authority, without further action by the shareholders, to issue and fix the rights and preferences of a new class, or classes, of preferred stock. These and other provisions of the Articles and our Bylaws may deter or delay changes in control, including transactions in which shareholders might otherwise receive a premium for their shares over then current market prices. In addition, these provisions may limit the ability of shareholders to approve transactions that they may deem to be in their best interests.
11
We are subject to control by certain shareholders and management. Members of the Koski family, including two Directors, Robert E. Koski, our founder and former Chairman, and Christine L. Koski, and their affiliates own or control approximately 29% of the outstanding shares of our common stock. Accordingly, the members of the Koski family have the ability to influence significantly the election of our directors and the outcome of certain corporate actions requiring shareholder approval, and to influence our business. Such influence could preclude any acquisition of the Company and could adversely affect the price of our common stock. Our directors and executive officers as a group beneficially own or control approximately 30% of the outstanding shares of our common stock.
| ITEM 1B. | UNRESOLVED STAFF COMMENTS |
None.
| ITEM 2. | PROPERTIES |
The Company owns major facilities in the United States, United Kingdom, Germany, and Korea, as set forth below.
The Company owns a 66,000 square foot facility in Sarasota, Florida, which houses manufacturing, design, marketing and other administrative functions. The Sarasota facility is well suited for the design, testing and manufacture of the Company’s products.
The Company also owns a 77,000 square foot manufacturing facility in Manatee County, Florida. The Manatee County facility, constructed in 1997, has a productive capacity similar to the Sarasota facility.
The close proximity of the Florida facilities allows for quick change and the ability to shift resources, including machinery and people, to effectively meet changing business requirements.
Both facilities in Florida are encumbered by a revolving line of credit, which matures on August 1, 2011. Monthly payment of interest only is due on the revolving line of credit, with a variable interest rate based upon the Company’s leverage ratio. At December 29, 2007, there was no outstanding balance on the line of credit.
The Company also owns vacant land in Manatee County, Florida, for future expansion requirements. There is no mortgage on this property and the Company believes the land to be well suited to add over 30,000 square feet of manufacturing capacity.
The Company leases a 17,000 square foot manufacturing facility in Lenexa, Kansas, which is used to manufacture manifolds for the North American market.
The Company owns a 37,000 square foot facility in Coventry, England, free of any encumbrances. The facility, while primarily acting as a distributor, is also involved in cartridge assembly and manifold manufacturing.
The Company’s 45,000 square foot distribution and manufacturing facility in Erkelenz, Germany is encumbered by a mortgage loan, which is due September 30, 2008, and has a fixed interest rate of 6.05%. At December 29, 2007, the principal balance was $0.3 million. This facility is well suited to house equipment used for manufacturing and testing of the Company’s products. Currently, a small portion of the manufacturing area is utilized and the remainder is leased on an annual basis to an outside company.
The Company owns a 10,000 square foot distribution and manufacturing facility in Inchon, Korea, free of any encumbrances.
12
The Company believes that its properties have been adequately maintained, are generally in good condition, and are suitable and adequate for its business as presently conducted. The extent of utilization of the Company’s properties varies from time to time and among its facilities.
| ITEM 3. | LEGAL PROCEEDINGS |
The Company from time to time is involved in routine litigation incidental to the conduct of its business. The Company does not believe that any pending litigation will have a material adverse effect on its consolidated financial position or results of operations.
| ITEM 4. | SUBMISSION OF MATTERS TO A VOTE OF SECURITY HOLDERS |
There were no matters submitted to a vote of the security holders of the Company through the solicitation of proxies or otherwise during the fourth quarter of the fiscal year ended December 29, 2007.
13
PART II
| ITEM 5. | MARKET FOR REGISTRANT’S COMMON EQUITY, RELATED STOCKHOLDER MATTERS AND ISSUER PURCHASES OF EQUITY SECURITIES |
Market Information
The Common Stock of the Company has been trading publicly under the symbol SNHY on the Nasdaq Global Select Market since the Company’s initial public offering on January 9, 1997. The following table sets forth the high and low closing sale prices of the Company’s Common Stock as reported by the Nasdaq Global Select Market and the dividends declared for the periods indicated. These stock prices and dividends are adjusted for a three-for-two stock split, effected in the form of a 50% stock dividend, which became effective on July 15, 2007.
| High | Low | Dividends declared | |||||||
| 2007 |
|||||||||
| First quarter |
$ | 18.300 | $ | 13.307 | $ | 0.067 | |||
| Second quarter |
32.833 | 17.460 | 0.090 | ||||||
| Third quarter |
37.990 | 22.520 | 0.090 | ||||||
| Fourth quarter |
35.990 | 25.130 | 0.090 | ||||||
| 2006 |
|||||||||
| First quarter |
$ | 25.390 | $ | 19.670 | $ | 0.067 | |||
| Second quarter |
22.450 | 16.950 | 0.067 | ||||||
| Third quarter |
20.720 | 16.620 | 0.067 | ||||||
| Fourth quarter |
22.130 | 19.970 | 0.067 | ||||||
Holders
There were 87 shareholders of record of Common Stock on February 29, 2008. The number of record holders was determined from the records of the Company’s transfer agent and does not include beneficial owners of Common Stock whose shares are held in the names of securities brokers, dealers, and registered clearing agencies. The Company believes that there are between 2,500 and 3,000 beneficial owners of Common Stock.
Dividends
Dividends were paid on the 15th day of each month following the date of declaration. The Company’s Board of Directors currently intends to continue to pay a quarterly dividend of at least $0.09 per share during 2008. However, the declaration and payment of future dividends is subject to the sole discretion of the Board of Directors, and any determination as to the payment of future dividends will depend upon the Company’s profitability, financial condition, capital needs, future prospects and other factors deemed pertinent by the Board of Directors.
Stock Split
On June 19, 2007, the Company declared a three-for-two stock split, effected in the form of a 50% stock dividend, to shareholders of record on June 30, 2007, which was paid on July 15, 2007. The Company issued approximately 5,500,000 shares of common stock as a result of the stock split. The effect of the stock split on outstanding shares, earnings per share and dividends per share has been retroactively applied to all periods presented.
On June 10, 2005, the Company declared a three-for-two stock split, effected in the form of a 50% stock dividend, to shareholders of record on June 30, 2005, payable on July 15, 2005. The Company issued approximately 3,600,000 shares of common stock as a result of the stock split. The effect of the stock split on outstanding shares, earnings per share and dividends per share has been retroactively applied to all periods presented.
14
Issuer Purchases of Equity Securities
The Company did not repurchase any of its stock during the fourth quarter of 2007.
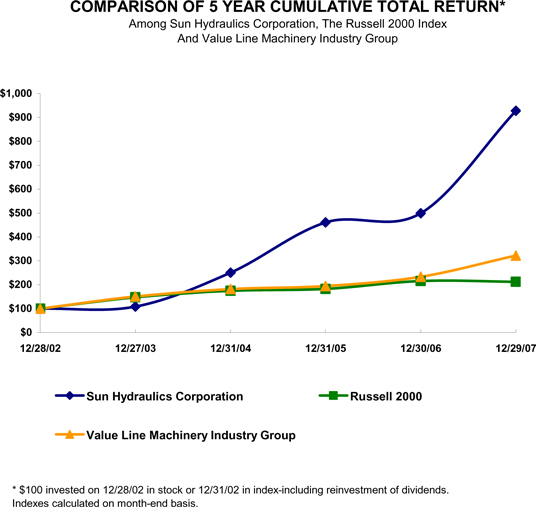
Five-Year Stock Performance Graph
The following graph compares cumulative total return among Sun Hydraulics Corporation, the Russell 2000 Index and the Value Line Machinery Industry Stock Index, from December 28, 2002, to December 29, 2007, assuming $100 invested in each on December 28, 2002. Total return assumes reinvestment of any dividends for all companies considered within the comparison. The stock price performance shown in the graph is not necessarily indicative of future price performance.
| 12/28/02 | 12/27/03 | 12/31/04 | 12/31/05 | 12/30/06 | 12/29/07 | |||||||
| Sun Hydraulics Corporation |
100.00 | 108.48 | 250.47 | 460.86 | 498.73 | 928.05 | ||||||
| Russell 2000 |
100.00 | 147.25 | 174.24 | 182.18 | 215.64 | 212.26 | ||||||
| Value Line Machinery Industry Group |
100.00 | 150.58 | 181.82 | 194.55 | 233.26 | 321.67 |
15
| ITEM 6. | SELECTED CONSOLIDATED FINANCIAL DATA |
The following summary should be read in conjunction with the consolidated financial statements and related notes contained herein. See “Item 7. Management’s Discussion and Analysis of Financial Condition and Results of Operations” and “Item 1. Business.”
The Company reports on a fiscal year that ends on the Saturday closest to December 31st. Each quarter generally consists of two 4-week periods and one 5-week period. As a result of the 2005 fiscal year ending December 31, 2005, the quarter ended April 2, 2005, consisted of one 4-week period and two 5-week periods, resulting in a 53-week year.
| Year Ended | |||||||||||||||
| Dec 29, 2007 | Dec 30, 2006 | Dec 31, 2005 | Dec 25, 2004 | Dec 27, 2003 | |||||||||||
| (in thousands except per share data) | |||||||||||||||
| Statement of Operations: |
|||||||||||||||
| Net sales |
$ | 167,374 | $ | 142,282 | $ | 116,757 | $ | 94,503 | $ | 70,798 | |||||
| Gross profit |
54,850 | 43,932 | 36,918 | 28,535 | 18,486 | ||||||||||
| Operating income |
33,635 | 25,051 | 19,180 | 12,294 | 3,683 | ||||||||||
| Income before income taxes |
34,371 | 24,903 | 19,137 | 11,732 | 3,277 | ||||||||||
| Net income |
$ | 22,131 | $ | 16,223 | $ | 12,808 | $ | 7,830 | $ | 2,176 | |||||
| Basic net income per common share |
$ | 1.35 | $ | 0.99 | $ | 0.79 | $ | 0.51 | $ | 0.15 | |||||
| Diluted net income per common share |
$ | 1.34 | $ | 0.99 | $ | 0.78 | $ | 0.50 | $ | 0.15 | |||||
| Dividends per common share |
$ | 0.34 | $ | 0.27 | $ | 0.20 | $ | 0.10 | $ | 0.96 | |||||
| Other Financial Data: |
|||||||||||||||
| Depreciation and amortization |
$ | 6,341 | $ | 5,849 | $ | 5,604 | $ | 5,465 | $ | 5,152 | |||||
| Capital expenditures |
12,591 | 9,525 | 8,813 | 4,987 | 3,076 | ||||||||||
| Balance Sheet Data: |
|||||||||||||||
| Cash and cash equivalents |
$ | 19,337 | $ | 9,497 | $ | 5,830 | $ | 9,762 | $ | 5,219 | |||||
| Working capital |
36,198 | 24,015 | 16,391 | 16,723 | 12,663 | ||||||||||
| Total assets |
110,780 | 87,185 | 73,561 | 71,808 | 63,032 | ||||||||||
| Total debt |
701 | 1,072 | 2,384 | 12,254 | 18,207 | ||||||||||
| Shareholders’ equity |
91,882 | 70,800 | 56,440 | 45,403 | 35,063 | ||||||||||
16
Quarterly Results of Operations
(unaudited, in thousands)
| For the Quarter Ended | ||||||||||||
| Dec 29, 2007 | Sep 29 2007 | Jun 30 2007 | Mar 31 2007 | |||||||||
| Net sales |
$ | 41,289 | $ | 41,809 | $ | 43,422 | $ | 40,854 | ||||
| Gross profit |
13,346 | 13,324 | 14,297 | 13,883 | ||||||||
| Operating income |
8,064 | 8,045 | 8,859 | 8,667 | ||||||||
| Income before income taxes |
8,198 | 8,280 | 9,045 | 8,849 | ||||||||
| Net income |
$ | 5,127 | $ | 5,246 | $ | 5,952 | $ | 5,806 | ||||
| Basic net income per common share |
$ | 0.31 | $ | 0.32 | $ | 0.36 | $ | 0.35 | ||||
| Diluted net income per common share |
$ | 0.31 | $ | 0.32 | $ | 0.36 | $ | 0.35 | ||||
| For the Quarter Ended | ||||||||||||
| Dec 30, 2006 | Sep 30 2006 | Jul 1, 2006 | Apr 1, 2006 | |||||||||
| Net sales |
$ | 34,967 | $ | 36,202 | $ | 36,928 | $ | 34,185 | ||||
| Gross profit |
11,051 | 10,662 | 11,239 | 10,981 | ||||||||
| Operating income |
6,237 | 5,955 | 6,549 | 6,310 | ||||||||
| Income before income taxes |
6,253 | 5,896 | 6,501 | 6,253 | ||||||||
| Net income |
$ | 3,813 | $ | 3,916 | $ | 4,314 | $ | 4,180 | ||||
| Basic net income per common share |
$ | 0.23 | $ | 0.24 | $ | 0.26 | $ | 0.25 | ||||
| Diluted net income per common share |
$ | 0.23 | $ | 0.24 | $ | 0.26 | $ | 0.25 | ||||
| Dec 31, 2005 | Oct 1, 2005 | Jul 2, 2005 | Apr 2, 2005 | |||||||||
| Net sales |
$ | 27,938 | $ | 28,726 | $ | 31,014 | $ | 29,079 | ||||
| Gross profit |
8,054 | 9,025 | 10,086 | 9,753 | ||||||||
| Operating income |
3,702 | 4,381 | 5,562 | 5,533 | ||||||||
| Income before income taxes |
3,833 | 4,202 | 5,583 | 5,518 | ||||||||
| Net income |
$ | 2,888 | $ | 2,918 | $ | 3,536 | $ | 3,466 | ||||
| Basic net income per common share |
$ | 0.18 | $ | 0.18 | $ | 0.22 | $ | 0.22 | ||||
| Diluted net income per common share |
$ | 0.18 | $ | 0.18 | $ | 0.21 | $ | 0.21 | ||||
17
| ITEM 7. | MANAGEMENT’S DISCUSSION AND ANALYSIS OF FINANCIAL CONDITION AND RESULTS OF OPERATIONS |
OVERVIEW
Sun Hydraulics Corporation is a leading designer and manufacturer of high-performance screw-in hydraulic cartridge valves and manifolds, which control force, speed and motion as integral components in fluid power systems. The Company sells its products globally through wholly owned subsidiaries and independent distributors. Sales outside the United States for the year ended December 29, 2007, were approximately 58% of total net sales.
Approximately 66% of product sales are used by the mobile market, which is characterized by applications where the equipment is not fixed in place, the operating environment is often unpredictable, and duty cycles are generally moderate to low. Some examples of mobile equipment include off-road construction equipment, fire and rescue equipment and mining machinery.
The remaining 34% of sales are used by industrial markets, which are characterized by equipment that is fixed in place, typically in a controlled environment, and which operates at higher pressures and duty cycles. Automation machinery, metal cutting machine tools and plastics machinery are some examples of industrial equipment. The Company sells to both markets with a single product line.
Company Focus
In recent years, the Company has realized robust growth in all areas of the world. Management believes there are five key reasons why:
| • | Product availability and on-time delivery performance, |
| • | New products, especially electrically actuated products, |
| • | Increased sales of integrated packages, |
| • | Our geographic presence, and |
| • | Our website. |
The company is continuously engaged in efforts to improve productivity to enhance productive capacity and be in the best position to be able to respond to marketplace demand. Company engineering and manufacturing personnel redesign existing products, where necessary, to improve manufacturability. New product design efforts include personnel from engineering, manufacturing and marketing to help reduce the time and effort required to release products to the market. These on-going activities enable the Company to maintain a level of delivery performance and shipping reliability that it believes differentiates it from its competitors.
The Company continues to add to its electrically actuated hydraulic valve offerings with many new products, including different types of solenoid and proportional valves and valves with position sensing devices. Electrically actuated cartridges help create new system opportunities as they enable the Company to offer complete integrated valve packages which could not be offered previously. The addition of electrically actuated hydraulic products allows integrated packages to be designed with 100% Sun content. Integrated packages, standard cartridges housed in a custom designed manifold, have been one of the Company’s fastest growing areas.
The Company has wholly-owned companies in North America, Europe and the Far East, augmented by what management believes to be the finest distribution network in the fluid power industry. In 2007, the Company opened a sales office in Bangalore, India. The Company’s distributors are particularly skilled in applying products and developing integrated solutions for the local market. Through its wholly-owned companies and global distribution network, the Company is able to service all major industrialized market areas.
The Company’s major marketing tool is its website, www.sunhydraulics.com. The Company’s website is developed to appeal to and be used by design engineers. It provides all the detailed technical information and specifications to select, apply and obtain Sun products, 24 hours a day, seven days a week. The website continues to evolve by adding greater levels of detail in technical information and configuration capability.
18
Industry Conditions
Demand for the Company’s products is dependent on demand for the capital goods into which the products are incorporated. The capital goods industries in general, and the fluid power industry specifically, are subject to economic cycles. According to the National Fluid Power Association (the fluid power industry’s trade association in the United States), the United States index of shipments of hydraulic products increased 1% and 9%, in 2007 and 2006, respectively.
The Company’s order trend has historically tracked closely to the United States Purchasing Managers Index (PMI). The index was 48.4 at the end of December 2007 compared to 51.4 at the end of December 2006. When the PMI is over 50, it indicates economic expansion.
Results for the 2007 fiscal year
(Dollars in millions except net income per share)
| December 29, 2007 |
December 30, 2006 |
Increase | |||||||
| Twelve Months Ended |
|||||||||
| Net Sales |
$ | 167.4 | $ | 142.3 | 18 | % | |||
| Net Income |
$ | 22.1 | $ | 16.2 | 36 | % | |||
| Net Income per share: |
|||||||||
| Basic |
$ | 1.35 | $ | 0.99 | 36 | % | |||
| Diluted |
$ | 1.34 | $ | 0.99 | 35 | % | |||
| Three Months Ended |
|||||||||
| Net Sales |
$ | 41.3 | $ | 35.0 | 18 | % | |||
| Net Income |
$ | 5.1 | $ | 3.8 | 34 | % | |||
| Net Income per share: |
|||||||||
| Basic |
$ | 0.31 | $ | 0.23 | 35 | % | |||
| Diluted |
$ | 0.31 | $ | 0.23 | 35 | % | |||
The strong fourth quarter capped off another great year. Last year’s momentum has continued into this year’s first quarter and the Company is forecasting another quarter of double digit growth.
The Company’s foreign sales expanded briskly in 2007. Approximately 80% of Sun’s growth last year was generated in Europe and Asia/Pacific, and that strong international demand is continuing in the first quarter.
Equally exciting is the fact that domestic demand was strong in the first two months of the year, with order activity up 11% compared to the first two months of 2007. After moderate 5% domestic growth in 2007 and despite the negative economic commentary we all hear, this is welcome news.
Sun’s new electrically actuated products introduced in Europe last year will receive their formal North American introduction at the International Fluid Power Exposition this month in Las Vegas. These products will feature WhiteOak’s on-board electronics. These are truly unique products in the marketplace and are well suited for use by many exhibitors. Management expects an equally favorable market reaction to that which they experienced in Europe when the products were launched in April 2007.
Dividends
The Company declared a quarterly dividend of $0.067 per share for the first quarter of 2007 and quarterly dividends of $0.09 per share for the remaining three quarters of 2007, for a total dividend of $0.337 for 2007. These dividends were paid on the 15th day of each month following the date of declaration. In addition, the Company declared a three-for-two stock split, effected in the form of a 50% stock dividend, to shareholders of record on June 30, 2007, which was paid on July 15, 2007.
19
Cash Flow
Net cash generated from operations for the year was $28.2 million, a $8.6 million increase compared to $19.6 million in 2006. Capital expenditures for the year were $12.6 million, cash on hand increased $9.8 million to $19.3 million, debt decreased $0.4 million to $0.7 million, and $5.2 million was paid to shareholders in dividends.
Results of Operations
The following table sets forth, for the periods indicated, certain items in the Company’s statements of operations as a percentage of net sales.
| For the Year Ended | |||||||||||||||
| Dec 29, 2007 | Dec 30, 2006 | Dec 31, 2005 | Dec 25, 2004 | Dec 27, 2003 | |||||||||||
| Net sales |
100.0 | % | 100.0 | % | 100.0 | % | 100.0 | % | 100.0 | % | |||||
| Gross profit |
32.8 | % | 30.9 | % | 31.6 | % | 30.2 | % | 26.1 | % | |||||
| Operating income |
20.1 | % | 17.6 | % | 16.4 | % | 13.0 | % | 5.2 | % | |||||
| Income before income taxes |
20.5 | % | 17.5 | % | 16.4 | % | 12.4 | % | 4.6 | % | |||||
Segment Information (in thousands)
| United States |
Korea | United Kingdom |
Germany | Elimination | Consolidated | ||||||||||||||
| 2007 |
|||||||||||||||||||
| Sales to unaffiliated customers |
$ | 99,516 | $ | 20,567 | $ | 23,127 | $ | 24,164 | $ | — | $ | 167,374 | |||||||
| Intercompany sales |
30,344 | — | 2,621 | 142 | (33,107 | ) | — | ||||||||||||
| Operating income |
22,408 | 2,103 | 3,205 | 5,955 | (36 | ) | 33,635 | ||||||||||||
| Identifiable assets |
74,026 | 9,067 | 17,079 | 12,710 | (2,102 | ) | 110,780 | ||||||||||||
| Depreciation and amortization |
4,488 | 178 | 1,119 | 556 | 6,341 | ||||||||||||||
| Capital expenditures |
9,339 | 284 | 2,843 | 125 | 12,591 | ||||||||||||||
| 2006 |
|||||||||||||||||||
| Sales to unaffiliated customers |
$ | 89,077 | $ | 16,368 | $ | 17,709 | $ | 19,128 | $ | — | $ | 142,282 | |||||||
| Intercompany sales |
25,809 | — | 2,990 | 106 | (28,905 | ) | — | ||||||||||||
| Operating income |
16,608 | 2,212 | 2,330 | 4,046 | (145 | ) | 25,051 | ||||||||||||
| Identifiable assets |
59,505 | 7,580 | 13,756 | 8,187 | (1,843 | ) | 87,185 | ||||||||||||
| Depreciation and amortization |
4,206 | 150 | 983 | 510 | 5,849 | ||||||||||||||
| Capital expenditures |
8,408 | 122 | 757 | 238 | 9,525 | ||||||||||||||
| 2005 |
|||||||||||||||||||
| Sales to unaffiliated customers |
$ | 73,998 | $ | 11,604 | $ | 16,054 | $ | 15,101 | $ | — | $ | 116,757 | |||||||
| Intercompany sales |
21,239 | — | 2,873 | 80 | (24,192 | ) | — | ||||||||||||
| Operating income |
13,443 | 1,520 | 1,260 | 3,145 | (188 | ) | 19,180 | ||||||||||||
| Identifiable assets |
50,019 | 4,958 | 12,403 | 8,777 | (2,596 | ) | 73,561 | ||||||||||||
| Depreciation and amortization |
3,944 | 149 | 1,025 | 473 | — | 5,591 | |||||||||||||
| Capital expenditures |
7,007 | 29 | 934 | 843 | — | 8,813 | |||||||||||||
Outlook for first quarter 2008
2008 first quarter sales are estimated to be in the range of $47 million, a 15% increase over last year. First quarter earnings per share are estimated to be between $0.41 and $0.43 per share, compared to $0.35 per share last year.
20
Comparison of Years Ended December 29, 2007 and December 30, 2006
Net Sales
Net sales were $167.4 million, an increase of $25.1 million, or 17.6%, compared to $142.3 million in 2006. Net sales increased 14.5% excluding the effect of exchange rates.
The increase was due in large part to the continued growth of international sales, particularly in Europe where sales increased 31.4%, or $13.0 million, to $54.3 million. Sales to France increased 27.0%, to Germany 30.5%, and to the U.K. 38.6%. Significant increases were also noted in Finland, Norway, Italy and Sweden.
Asian sales increased 28.5%, or $6.7 million, to $30.2 million. Domestic sales in Korea increased 25.7%, and sales to China increased 52.3%. A significant increase was also noted in Singapore.
North American sales increased 6.4%, or $4.7 million, to $78.7 million.
Gross Profit
Gross profit increased 24.9% to $54.9 million in 2007, compared to $43.9 million in 2006. Gross profit as a percentage of net sales increased to 32.8% in 2007, compared to 30.9% in 2006. Gross profit percentage increases were due to fixed cost absorption from higher sales volume, a sales price increase that occurred in July 2006, productivity improvements in the U.S. and improvements in selective material pricing on high volume purchased parts. Lower material costs in the U.K. and German operations due to the strength of local currencies against the U.S. dollar for material purchases made in U.S. dollars were also recognized.
Selling, Engineering, and Administrative Expenses
Selling, engineering and administrative expenses in 2007 were $21.2 million, a $2.3 million, or 12.4%, increase, compared to $18.9 million in 2006. The change is primarily a result of increased compensation expenses, which includes stock based compensation awards, advertising, and professional fees relating to tax, legal matters, and outside information technology services.
Interest (Income)/Expense, Net
Net Interest income for 2007 was $0.4 million compared to net interest expense of $0.1 million for 2006. Total average debt for 2007, was $0.9 million compared to $1.7 million for 2006. Total average cash for 2007, was $14.4 million compared to $7.7 million for 2006. The Company did not have any outstanding variable debt during 2007.
Foreign Currency Transaction (Gain)/Loss, Net
Foreign currency transaction gain was minimal in 2007, compared to a loss of $0.2 million in 2006. While the Euro, the Korean Won and the British Pound made gains against the U.S. dollar during the periods, the European operations experienced losses related to sales conducted in U.S. dollars and from the revaluation of Sun Ltd. balance sheet items, which were held in U.S. dollars.
Miscellaneous Income, Net
Miscellaneous income was $0.3 and $0.2, in 2007 and 2006, respectively. The increase was primarily a result of earnings from joint ventures.
Income Taxes
The provision for income taxes for the year ended December 29, 2007, was 35.6% of pretax income compared to 34.9% for the year ended December 30, 2006. The change was primarily due to the relative levels of income and different tax rates in effect among the countries in which the Company sells its
21
products and an increase in the U.S. effective rate of approximately 1.3%. The increase was primarily a result of the phase-out of graduated rates and a change in permanent items, primarily related to the decreased benefit from joint venture earnings. These amounts were partially offset by the reversal of an unrecognized tax benefit during the period.
Comparison of Years Ended December 30, 2006 and December 31, 2005
Net Sales
Net sales were $142.3 million, an increase of $25.5 million, or 21.8%, compared to $116.8 million in 2005. Net sales increased 21.4% excluding the effect of exchange rates.
The increase was due in large part to the continued growth of international sales, particularly in Asia where sales increased 41.9%, or $6.9 million, to $23.4 million. Domestic sales in Korea increased 41.1%, sales to China increased 63.0%, and to Japan 36.6%.
European sales increased 26.0%, or $8.5 million, to $41.2 million. Sales to France increased 20.5%, to Germany 23.0%, and to the U.K. 19.5%. Significant increases were also noted in Norway, Italy, Ireland and Sweden.
North American sales increased 14.2%, or $9.2 million, to $74.0 million.
Gross Profit
Gross profit increased 19.0% to $43.9 million in 2006, compared to $36.9 million in 2005. Gross profit as a percentage of net sales decreased to 30.9% in 2006, compared to 31.6% in 2005. Declines in the gross profit percentage were due to higher variable costs and an increased fixed cost base. Increased materials, fringe benefits, and productivity declines during the third quarter accounted for the majority of the increased variable costs. The fixed cost increases were primarily made up of salaries, fringe benefits, utilities, and depreciation. Gross profit percentage decreases were partially offset by higher sales volume and sales price increases that occurred in January and July of this year.
Selling, Engineering, and Administrative Expenses
Selling, engineering and administrative expenses in 2006 were $18.9 million, a $1.1 million, or 6.4%, increase, compared to $17.7 million in 2005. The increase was primarily due to increases in compensation expense, including additional engineering and marketing personnel, and insurance. These increases were partially offset by decreased advertising and professional fees. The prior year period included higher audit and contract labor fees, including Sarbanes-Oxley 404 compliance, and a write-off of the remaining deferred loan costs related to the extinguishment of debt.
Interest Expense, Net
Net interest expense was $0.1 million and $0.4 million, in 2006 and 2005, respectively. While average outstanding debt decreased $5.6 million, from $7.3 million in 2005 to $1.7 million in 2006, the average interest rate on variable debt increased from the period ended December 31, 2005, due to an increase in the LIBOR rate.
Foreign Currency Transaction (Gain)/Loss, Net
Foreign currency transaction loss in 2006 was $0.2, compared to a gain of $0.4 million in 2005. While the Euro, the Korean Won and the British Pound made gains against the U.S. dollar during 2006, the U.K. operations experienced losses related to sales conducted in U.S. dollars and from the revaluation of balance sheet items which were held in U.S. dollars.
Miscellaneous Income, Net
Miscellaneous income was $0.2 in 2006 compared to a minimal amount in 2005. The increase was primarily a result of earnings from joint ventures.
22
Income Taxes
The provision for income taxes for the year ended December 30, 2006, was 34.9% of pretax income compared to 33.1% for the year ended December 31, 2005. The change was primarily due to the relative levels of income and different tax rates in effect among the countries in which the Company sells its products and an increase in the U.S. effective rate of almost 2%. The increase in the effective rate was primarily a result of additional U.S. income taxed at the higher incremental federal tax rate and an increase in state taxes. The prior year provision included a cumulative benefit for a deduction in the state tax rate and a benefit for the change in foreign valuation allowance.
Liquidity and Capital Resources
Historically, the Company’s primary source of capital has been cash generated from operations, although short-term fluctuations in working capital requirements have been met through borrowings under revolving lines of credit as needed. The Company’s principal uses of cash have been to pay operating expenses, pay dividends to shareholders, make capital expenditures, and service debt.
Net cash flow from operations in 2007 was $28.2 million, compared to $19.6 million in 2006 and $17.0 million in 2005. The $8.6 million increase in the Company’s net cash flow from operations in 2007 was due primarily to the increase in net income of $5.9 million, and increases in accounts payable, and accrued expenses. In addition, the Company did not experience as much of an increase in inventory compared to the prior year period. Cash on hand increased $9.8 million from $9.5 million in 2006 to $19.3 million in 2007. Days sales outstanding increased to 38 in 2007 from 36 in 2006 and inventory turns increased to 9.9 in 2007 from 9.5 in 2006. The increase in the Company’s net cash flow from operations in 2006, compared to 2005 was due primarily to the increase in net income of $3.4 million, the change in deferred taxes, increases to accrued expenses and other liabilities, and income taxes payable. These cash increases were partially offset by increases in accounts receivable and inventory.
Capital expenditures, consisting primarily of purchases of machinery and equipment, were $12.6 million in 2007, compared to $9.5 million in 2006 and $8.8 million in 2005. Capital expenditures in 2008 are projected to be $13.0 million.
On August 11, 2005, the Company completed a refinancing of its existing debt in the U.S. with Fifth Third Bank (the “Bank”). The new financing consists of a secured revolving line of credit of $35 million (the “Line of Credit”). The Line of Credit is secured by the Company’s U.S. assets, including its manufacturing facilities, and requires monthly payments of interest. The Line of Credit has a floating interest rate based upon the Company’s leverage ratio. The Line of Credit is payable in full on August 1, 2011, but maturity may be accelerated by the Bank upon an Event of Default (as defined). Prepayment may be made without penalty or premium at any time upon the required notice to the Bank. At December 29, 2007, the Line of Credit had no outstanding balance.
The Line of Credit is subject to debt covenants including: 1) Debt (as defined) to Tangible Net Worth (as defined) ratio of not more than 1.5:1.0, 2) Funded Debt (as defined) to EBITDA (as defined) ratio of not more than 2.5:1.0, and 3) EBIT (as defined) to Interest Expense (as defined) ratio of not less than 1.1:1.0; and requires the Company to maintain its primary domestic deposit accounts with the Bank. As of December 29, 2007, the Company was in compliance with all debt covenants.
The Company declared the following quarterly dividends to shareholders of record on the last day of the respective quarter:
| 2007 | 2006 | 2005 | |||||||
| First quarter |
$ | 0.067 | $ | 0.067 | $ | 0.033 | |||
| Second quarter |
0.090 | 0.067 | 0.033 | ||||||
| Third quarter |
0.090 | 0.067 | 0.067 | ||||||
| Fourth quarter |
0.090 | 0.067 | 0.067 | ||||||
23
These dividends were paid on the 15th day of each month following the date of declaration. In addition, the Company declared 50% stock dividends on June 30, 2007 and June 30, 2005.
The declaration and payment of future dividends is subject to the sole discretion of the Board of Directors, and any determination as to the payment of future dividends will depend upon the Company’s profitability, financial condition, capital needs, future prospects and other factors deemed pertinent by the Board of Directors.
The Company believes that cash generated from operations and its borrowing availability under the revolving Line of Credit will be sufficient to satisfy the Company’s operating expenses and capital expenditures for the foreseeable future. In the event that economic conditions were to severely worsen for a protracted period of time, the Company would have several options available to ensure liquidity in addition to increased borrowing. Capital expenditures could be postponed since they primarily pertain to long-term improvements in operations. Additional operating expense reductions also could be made. Finally, the dividend to shareholders could be reduced or suspended.
In June 2006, the Company’s Board of Directors authorized the repurchase of up to $2.5 million of Company stock, to be completed no later than January 15, 2007. The stock purchases were made in the open market. Market purchases were made subject to restrictions relating to volume, price and timing in an effort to minimize the impact of the purchases on the market for the Company’s securities. The amount of the stock repurchased was used to continue to fund the Company’s employee stock ownership and employee stock purchase plans. Under the plan, which was completed in July, the Company had repurchased 203,073 shares at an average price of $12.31. All shares were retired during the year.
In December 2005, the Company’s Board of Directors authorized the repurchase of up to $2.0 million of Company stock, to be completed no later than January 15, 2007. The stock purchases were made in the open market. Market purchases were made subject to restrictions relating to volume, price and timing in an effort to minimize the impact of the purchases on the market for the Company’s securities. The amount of the stock repurchases was set based upon the anticipated number of shares that were required to fund the Company’s ESOP, and employee stock purchase plan, through fiscal year 2006. The Company had repurchased 123,750 shares at an average cost of $12.58 per share and 34,047 shares at an average cost of $13.01 for the periods ending December 31, 2005 and December 30, 2006, respectively. Of the 123,750 shares purchased in 2005, 97,500 were retired prior to December 31, 2005. All remaining shares and purchases were retired during 2006.
In November 2004, the Company’s Board of Directors authorized the repurchase of up to $2.5 million of Company stock, to be completed no later than January 15, 2006. The amount of the stock repurchases was set based upon the anticipated number of shares that were required to fund the Company’s ESOP, and employee stock purchase plan, through fiscal year 2005. The Company purchased 13,050 shares at an average cost of $6.35 per share and 4,050 shares at an average cost of $6.53 per share for the periods ending December 25, 2004 and December 31, 2005, respectively. The stock purchases were made in the open market. Market purchases were made subject to restrictions relating to volume, price and timing in an effort to minimize the impact of the purchases on the market for the Company’s securities. All shares were retired during the year of purchase.
OTHER MATERIAL COMMITMENTS. Our contractual obligations and debt obligations as of December 29, 2007, are summarized in the table below (in thousands):
| Payments due by Period | |||||||||||||||
| CONTRACTUAL OBLIGATIONS | TOTAL | LESS THAN 1 YEAR |
1-3 YEARS |
3-5 YEARS |
MORE THAN 5 YEARS | ||||||||||
| Debt |
$ | 701 | 417 | 251 | 33 | — | |||||||||
| Operating leases |
195 | 151 | 44 | — | — | ||||||||||
| Other long term liabilities (1) |
406 | 50 | 78 | — | 278 | ||||||||||
| Total contractual obligations |
$ | 1,302 | $ | 618 | $ | 373 | $ | 33 | $ | 278 | |||||
| (1) | Other long term liabilities consist of deferred income of $128 and deferred compensation of $278. The deferred income is a result of the supply agreement with Mannesmann Rexroth, A.G., a German full-line hydraulic component and systems manufacturer, entered into during 1999. This agreement expires in 2010. Deferred compensation relates to Director compensation for attendance at Board meetings. Amounts will be paid upon an individual ceasing to be a Director of the Company. |
24
Critical Accounting Policies and Estimates
The Company currently only applies judgment and estimates which may have a material effect on the eventual outcome of assets, liabilities, revenues and expenses for impairment of long-lived assets, accounts receivable, inventory, goodwill and accruals. The following explains the basis and the procedure for each account where judgment and estimates are applied.
Revenue Recognition
The Company reports revenues, net of sales incentives, when title passes and risk of loss transfers to the customer. The effect of material non-recurring events is provided for when they become known.
Impairment of Long-Lived Assets
In accordance with Statement of Financial Accounting Standards (“SFAS”) No. 144, Accounting for Impairment or Disposal of Long-lived Assets (“SFAS 144”), long-lived assets, such as property and equipment, and purchased intangibles subject to amortization, are reviewed for impairment whenever events or changes in circumstances indicate that the carrying amount of an asset may not be recoverable. Recoverability of the asset is measured by comparison of its carrying amount to future net cash flows the asset is expected to generate. If such assets are considered to be impaired, the impairment to be recognized is measured as the amount by which the carrying amount of the asset exceeds its fair value.
The Company assesses the recoverability of goodwill and intangible assets not subject to amortization under SFAS No. 142, Goodwill and Other Intangible Assets (“SFAS 142”). See Goodwill below.
Accounts Receivable
The Company sells to most of its customers on a recurring basis, primarily through distributors with which the Company maintains long-term relationships. As a result, bad debt experience has not been material. The allowance for doubtful accounts is determined on a specific identification basis by a review of those accounts that are significantly in arrears. There can be no assurance that a distributor or a large direct sale customer with overdue accounts receivable balances will not develop financial difficulties and default on payment. See Consolidated Balance Sheets for allowance amounts.
Inventory
The Company offers a wide variety of standard products and as a matter of policy does not discontinue products. On an ongoing basis, component parts found to be obsolete through design or process changes are disposed of and charged to material cost. The Company reviews on-hand balances of products and component parts against specific criteria. Products and component parts without usage or that have excess quantities on hand are evaluated. An inventory reserve is then established for the full inventory carrying value of those products and component parts deemed to be obsolete or slow moving. See Note 6 to the Financial Statements for inventory reserve amounts.
Goodwill
The Company acquired its Korean operations in September 1998 using the purchase method. As a result, goodwill is reflected on the Consolidated Balance Sheet. A valuation based on the cash flow method was performed at December 29, 2007 and December 30, 2006. It was determined that the value of the goodwill was not impaired. There is no assurance that the value of the acquired company will not decrease in the future due to changing business conditions. See Note 8 to the Financial Statements for goodwill amounts.
Accruals
The Company makes estimates related to certain employee benefits and miscellaneous accruals. Estimates for employee benefit accruals are based on information received from plan administrators in conjunction with management’s assessments of estimated liabilities related to workers’ compensation,
25
health care benefits and annual contributions to an employee stock ownership plan (“ESOP”), established in 2004 as part of the Company’s retirement plan. Estimates for miscellaneous accruals are based on management’s assessment of estimated liabilities for costs incurred.
As of July 1, 2003, the Company accrues for health care benefit costs under a self-funded plan utilizing estimates provided by a third party administrator and insurance company. The Company purchases re-insurance for both specific and aggregate stop losses on claims that exceed $100,000 on an individual basis and approximately $5.8 million on an aggregate basis.
New Accounting Pronouncements
In December 2007, the Financial Accounting Standards Board (“FASB”) issued SFAS No. 141 (revised 2007), Business Combinations (“SFAS 141R”). SFAS 141R establishes principles and requirements for an acquiring entity to recognize and measure in its financial statements the identifiable assets acquired, the liabilities assumed, any noncontrolling interest in the acquiree and the goodwill acquired. SFAS 141R expands on required disclosures to improve the statement users’ abilities to evaluate the nature and financial effects of business combinations. SFAS 141R is effective for fiscal years beginning after December 15, 2008. The Company is currently evaluating the potential impact, if any, of the adoption of SFAS 141R on its Consolidated Financial Statements.
In December 2007, the FASB issued SFAS No. 160, Noncontrolling Interests in Consolidated Financial Statements—an amendment of ARB No. 51 (“SFAS 160”). SFAS 160 requires that a noncontrolling interest in a subsidiary be reported within equity and the amount of consolidated net income attributable to the noncontrolling interest be identified in the consolidated financial statements. SFAS 160 calls for consistency in the manner of reporting changes in the parent’s ownership interest and requires fair value measurement of any noncontrolling equity investment retained in a deconsolidation. SFAS No. 160 also establishes disclosure requirements that clearly identify and distinguish between the interests of the parent and the interests of the noncontrolling owners. SFAS No. 160 is effective for fiscal years beginning after December 15, 2008. The Company is currently evaluating the potential impact, if any, of the adoption of SFAS 160 on its Consolidated Financial Statements.
In February 2007, FASB issued SFAS No. 159, The Fair Value Option for Financial Assets and Financial Liabilities (“SFAS 159”), which gives entities the option to measure eligible financial assets, and financial liabilities at fair value on an instrument by instrument basis, that are otherwise not permitted to be accounted for at fair value under other accounting standards. The election to use the fair value option is available when an entity first recognizes a financial asset or financial liability. Subsequent changes in fair value must be recorded in earnings. This statement is effective as of the beginning of a company’s first fiscal year after November 15, 2007. The adoption of this Statement is not expected to have a material effect on the Company’s Consolidated Financial Statements.
In September 2006, FASB issued SFAS No. 157, Fair Value Measurements (“SFAS 157”). SFAS 157 defines fair value, establishes a framework for measuring fair value in accordance with generally accepted accounting principles, and expands disclosures about fair value measurements. SFAS 157 is effective for fiscal years beginning after November 15, 2007. The adoption of this Statement is not expected to have a material effect on the Company’s Consolidated Financial Statements.
Off Balance Sheet Arrangements
The Company does not engage in any off balance sheet financing arrangements. In particular, the Company does not have any interest in variable interest entities, which include special purpose entities and structured finance entities.
The Company uses the equity method of accounting to account for its investments in Sun China, WhiteOak and High Country Tek. The Company does not have a majority ownership in or exercise control over any of these entities. The Company does not believe that its investments in Sun China, WhiteOak, or High Country Tek qualify as Variable Interest Entities, within the scope of FASB Interpretation (FIN) No. 46(R), Consolidation of Variable Interest Entities (revised December 2003), an interpretation of ARB No. 51, nor are they material to the financial statements of the Company at December 29, 2007.
26
Seasonality
The Company generally has experienced increased sales during the second quarter of the year largely as a result of the order patterns of our customers. As a result, the Company’s second quarter net sales, income from operations, and net income historically are the highest of any quarter during the year.
Inflation
The impact of inflation on the Company’s operating results has been moderate in recent years, reflecting generally lower rates of inflation in the economy. While inflation has not had, and the Company does not expect that it will have, a material impact upon operating results, there is no assurance that the Company’s business will not be affected by inflation in the future.
27
| ITEM 7A. | QUANTITATIVE AND QUALITATIVE DISCLOSURES ABOUT MARKET RISK |
The Company is exposed to market risk from changes in interest rates on borrowed funds, which could affect its results of operations and financial condition. The Company has managed this risk by its ability to select the interest rate on its debt financing at LIBOR plus 1.5% or the Bank’s Base Rate, whichever is more advantageous. Beginning in August 2006, the interest rate on its debt financing will remain variable based upon the Company’s leverage ratio. The Company had no variable-rate debt outstanding at December 29, 2007, and December 30, 2006.
The Company’s exposure to foreign currency exchange fluctuations relates primarily to the direct investment in its facilities in the United Kingdom, Germany, and Korea. The Company does not use financial instruments to hedge foreign currency exchange rate changes.
| ITEM 8. | FINANCIAL STATEMENTS AND SUPPLEMENTARY DATA |
| Index to financial statements: |
||
| Report of Independent Registered Certified Public Accounting Firm |
29 | |
| 30 | ||
| Consolidated Balance Sheets as of December 29, 2007 and December 30, 2006 |
31 | |
| 32 | ||
| 33 | ||
| 34 | ||
| 35 | ||
28
REPORT OF INDEPENDENT REGISTERED CERTIFIED PUBLIC ACCOUNTING FIRM
To the Board of Directors and Stockholders of
Sun Hydraulics Corporation:
We have audited the accompanying consolidated balance sheets of Sun Hydraulics Corporation (a Florida corporation) and subsidiaries (collectively, The Company) as of December 29, 2007 and December 30, 2006, and the related consolidated statements of operations, shareholders’ equity and comprehensive income, and cash flows for the years then ended. We also have audited Sun Hydraulics Corporation and subsidiaries internal control over financial reporting as of December 29, 2007, based on criteria established in Internal Control – Integrated Framework issued by the Committee of Sponsoring Organizations of the Treadway Commission (COSO). The Company’s management is responsible for these financial statements, for maintaining effective internal control over financial reporting, and for its assessment of the effectiveness of internal control over financial reporting. Our responsibility is to express an opinion on these financial statements and an opinion of the Company’s internal control over financial reporting based on our audits.
We conducted our audits in accordance with the standards of the Public Company Accounting Oversight Board (United States). Those standards require that we plan and perform the audits to obtain reasonable assurance about whether the consolidated financial statements are free of material misstatement and whether effective internal control over financial reporting was maintained in all material respects. Our audits of the consolidated financial statements included examining, on a test basis, evidence supporting the amounts and disclosures in the financial statements, assessing the accounting principles used and significant estimates made by management, and evaluating the overall financial statement presentation. Our audit of internal control over financial reporting included obtaining an understanding of internal control over financial reporting, assessing the risk that a material weakness exists, and testing and evaluating the design and operating effectiveness of internal control based on the assessed risk. Our audits also included performing such other procedures as we considered necessary in the circumstances. We believe that our audits provide a reasonable basis for our opinions.
A company’s internal control over financial reporting is a process designed to provide reasonable assurance regarding the reliability of financial reporting and the preparation of financial statements for external purposes in accordance with generally accepted accounting principles. A company’s internal control over financial reporting includes those policies and procedures that (1) pertain to the maintenance of records that, in reasonable detail, accurately and fairly reflect the transactions and dispositions of the assets of the company; (2) provide reasonable assurance that transactions are recorded as necessary to permit preparation of financial statements in accordance with generally accepted accounting principles, and that receipts and expenditures of the company are being made only in accordance with authorizations of management and directors of the company; and (3) provide reasonable assurance regarding prevention or timely detection of unauthorized acquisition, use, or disposition of the company’s assets that could have a material effect on the financial statements.
Because of its inherent limitation, internal control over financial reporting may not prevent or detect misstatements. Also, projections of any evaluation of effectiveness to future periods are subject to the risk that controls may become inadequate because of changes in conditions, or that the degree of compliance with the policies or procedures may deteriorate.
In our opinion, the consolidated financial statements referred to above present fairly, in all material respects, the financial position of Sun Hydraulics Corporation and subsidiaries as of December 29, 2007 and December 30, 2006, and the results of its operations and its cash flows for the years then ended in conformity with accounting principles generally accepted in the United States of America. Also, in our opinion, Sun Hydraulics Corporation and subsidiaries maintained, in all material respects, effective internal control over financial reporting as of December 29, 2007, based on criteria established in Internal Control – Integrated Framework issued by the Committee of Sponsoring Organizations of the Treadway Commission (COSO).
/s/ Kirkland, Russ, Murphy & Tapp, P.A.
Clearwater, Florida
February 29, 2008
29
REPORT OF INDEPENDENT REGISTERED PUBLIC ACCOUNTING FIRM
To the Board of Directors and
Shareholders of Sun Hydraulics Corporation:
We have audited the accompanying consolidated statements of operations, shareholders’ equity and comprehensive income, and cash flows of Sun Hydraulics Corporation (a Florida corporation) and subsidiaries for the year ended December 31, 2005. These financial statements are the responsibility of the Company’s management. Our responsibility is to express an opinion on these financial statements based on our audit.
We conducted our audit in accordance with the standards of the Public Company Accounting Oversight Board (United States). Those standards require that we plan and perform the audit to obtain reasonable assurance about whether the financial statements are free of material misstatement. An audit includes examining, on a test basis, evidence supporting the amounts and disclosures in the financial statements. An audit also includes assessing the accounting principles used and significant estimates made by management, as well as evaluating the overall financial statement presentation. We believe that our audit provides a reasonable basis for our opinion.
In our opinion, the consolidated statements of operations, shareholders’ equity and comprehensive income, and cash flows referred to above present fairly, in all material respects, the results of operations of Sun Hydraulics Corporation and subsidiaries for the year ended December 31, 2005 in conformity with accounting principles generally accepted in the United States of America.
/s/ GRANT THORNTON LLP
Tampa, Florida
March 6, 2006
30
Consolidated Balance Sheets
(in thousands, except for share information)
| December 29, 2007 | December 30, 2006 | |||||
| Assets |
||||||
| Current assets: |
||||||
| Cash and cash equivalents |
$ | 19,191 | $ | 9,379 | ||
| Restricted cash |
146 | 118 | ||||
| Accounts receivable, net of allowance for doubtful accounts of $215 and $140 |
17,029 | 13,917 | ||||
| Inventories |
11,421 | 10,386 | ||||
| Deferred income taxes |
301 | 219 | ||||
| Other current assets |
1,210 | 986 | ||||
| Total current assets |
49,298 | 35,005 | ||||
| Property, plant and equipment, net |
56,999 | 50,355 | ||||
| Other assets |
4,483 | 1,825 | ||||
| Total assets |
$ | 110,780 | $ | 87,185 | ||
| Liabilities and shareholders’ equity |
||||||
| Current liabilities: |
||||||
| Accounts payable |
$ | 5,668 | $ | 4,812 | ||
| Accrued expenses and other liabilities |
4,857 | 4,059 | ||||
| Long-term debt due within one year |
417 | 426 | ||||
| Dividends payable |
1,484 | 1,085 | ||||
| Income taxes payable |
674 | 608 | ||||
| Total current liabilities |
13,100 | 10,990 | ||||
| Long-term debt due after one year |
284 | 646 | ||||
| Deferred income taxes |
5,108 | 4,451 | ||||
| Other noncurrent liabilities |
406 | 298 | ||||
| Total liabilities |
18,898 | 16,385 | ||||
| Commitments and contingencies (Note 19) |
— | — | ||||
| Shareholders’ equity: |
||||||
| Preferred stock, 2,000,000 shares authorized, par value $0.001, no shares outstanding |
— | — | ||||
| Common stock, 20,000,000 shares authorized, par value $0.001, 16,493,300 and 16,273,974 shares outstanding |
16 | 16 | ||||
| Capital in excess of par value |
34,390 | 30,962 | ||||
| Retained earnings |
51,844 | 35,279 | ||||
| Accumulated other comprehensive income |
5,632 | 4,543 | ||||
| Total shareholders’ equity |
91,882 | 70,800 | ||||
| Total liabilities and shareholders’ equity |
$ | 110,780 | $ | 87,185 | ||
The accompanying Notes to the Consolidated Financial Statements are an integral part of these financial statements.
31
Consolidated Statements of Operations
(in thousands, except per share data)
| For the year ended | ||||||||||||
| December 29, 2007 | December 30, 2006 | December 31, 2005 | ||||||||||
| Net sales |
$ | 167,374 | $ | 142,282 | $ | 116,757 | ||||||
| Cost of sales |
112,524 | 98,350 | 79,839 | |||||||||
| Gross profit |
54,850 | 43,932 | 36,918 | |||||||||
| Selling, engineering and administrative expenses |
21,215 | 18,881 | 17,738 | |||||||||
| Operating income |
33,635 | 25,051 | 19,180 | |||||||||
| Interest (income)/expense, net |
(411 | ) | 126 | 441 | ||||||||
| Foreign currency transaction (gain) loss, net |
(42 | ) | 187 | (362 | ) | |||||||
| Miscellaneous income, net |
(283 | ) | (165 | ) | (36 | ) | ||||||
| Income before income taxes |
34,371 | 24,903 | 19,137 | |||||||||
| Income tax provision |
12,240 | 8,680 | 6,329 | |||||||||
| Net income |
$ | 22,131 | $ | 16,223 | $ | 12,808 | ||||||
| Basic net income per common share |
$ | 1.35 | $ | 0.99 | $ | 0.79 | ||||||
| Weighted average basic shares outstanding |
16,437 | 16,317 | 16,241 | |||||||||
| Diluted net income per common share |
$ | 1.34 | $ | 0.99 | $ | 0.78 | ||||||
| Weighted average diluted shares outstanding |
16,498 | 16,408 | 16,377 | |||||||||
| Dividends declared per share |
$ | 0.337 | $ | 0.267 | $ | 0.200 | ||||||
The accompanying Notes to the Consolidated Financial Statements are an integral part of these financial statements.
32
Consolidated Statement of Shareholders’ Equity and Comprehensive Income
(in thousands)
| Preferred Shares |
Preferred Stock |
Common Shares |
Common stock |
Capital in excess of par value |
Unearned Compensation related to restricted stock |
Retained earnings |
Accumulated other comprehensive income |
Treasury stock |
Total | ||||||||||||||||||||||||||
| Balance, December 25, 2004 |
— | $ | — | 15,663 | $ | 15 | $ | 28,579 | $ | (608 | ) | $ | 13,862 | $ | 3,566 | $ | (11 | ) | $ | 45,403 | |||||||||||||||
| Shares issued, Restricted Stock |
39 | 475 | (133 | ) | 342 | ||||||||||||||||||||||||||||||
| Shares issued, Stock Options |
557 | 1 | 2,510 | 2,511 | |||||||||||||||||||||||||||||||
| Shares issued, ESPP |
18 | 157 | 157 | ||||||||||||||||||||||||||||||||
| Shares issued, ESOP |
165 | 1,058 | 1,058 | ||||||||||||||||||||||||||||||||
| Shares retired, Repurchase Agreement |
(102 | ) | (1,250 | ) | 11 | (1,239 | ) | ||||||||||||||||||||||||||||
| Purchase of treasury stock |
(349 | ) | (349 | ) | |||||||||||||||||||||||||||||||
| Tax benefit of stock-based compensation |
937 | 937 | |||||||||||||||||||||||||||||||||
| Dividends issued |
(3,269 | ) | (3,269 | ) | |||||||||||||||||||||||||||||||
| Comprehensive income: |
|||||||||||||||||||||||||||||||||||
| Net income |
12,808 | 12,808 | |||||||||||||||||||||||||||||||||
| Foreign currency translation adjustments |
(1,919 | ) | (1,919 | ) | |||||||||||||||||||||||||||||||
| Comprehensive income: |
10,889 | ||||||||||||||||||||||||||||||||||
| Balance, December 31, 2005 |
— | $ | — | 16,340 | $ | 16 | $ | 32,466 | $ | (741 | ) | $ | 23,401 | $ | 1,647 | $ | (349 | ) | $ | 56,440 | |||||||||||||||
| Adjustment of unearned compensation, restricted stock |
(741 | ) | 741 | — | |||||||||||||||||||||||||||||||
| Forfeitures, restricted stock |
(3 | ) | |||||||||||||||||||||||||||||||||
| Shares issued, Restricted Stock |
45 | — | |||||||||||||||||||||||||||||||||
| Shares issued, Stock Options |
47 | 162 | 162 | ||||||||||||||||||||||||||||||||
| Shares issued, ESPP |
21 | 238 | 238 | ||||||||||||||||||||||||||||||||
| Shares issued, ESOP |
87 | 1,183 | 1,183 | ||||||||||||||||||||||||||||||||
| Shares retired, Repurchase Agreement |
(263 | ) | (3,300 | ) | 923 | (2,377 | ) | ||||||||||||||||||||||||||||
| Purchase of treasury stock |
(574 | ) | (574 | ) | |||||||||||||||||||||||||||||||
| Stock-based compensation |
573 | 573 | |||||||||||||||||||||||||||||||||
| Tax benefit of stock-based compensation |
381 | 381 | |||||||||||||||||||||||||||||||||
| Dividends issued |
(4,345 | ) | (4,345 | ) | |||||||||||||||||||||||||||||||
| Comprehensive income: |
|||||||||||||||||||||||||||||||||||
| Net income |
16,223 | 16,223 | |||||||||||||||||||||||||||||||||
| Foreign currency translation adjustments |
2,896 | 2,896 | |||||||||||||||||||||||||||||||||
| Comprehensive income: |
19,119 | ||||||||||||||||||||||||||||||||||
| Balance, December 30, 2006 |
— | $ | — | 16,274 | $ | 16 | $ | 30,962 | $ | — | $ | 35,279 | $ | 4,543 | $ | — | $ | 70,800 | |||||||||||||||||
| Forfeitures, restricted stock |
(2 | ) | |||||||||||||||||||||||||||||||||
| Shares issued, Restricted Stock |
27 | — | |||||||||||||||||||||||||||||||||
| Shares issued, Stock Options |
73 | 287 | 287 | ||||||||||||||||||||||||||||||||
| Shares issued, ESPP |
18 | 272 | 272 | ||||||||||||||||||||||||||||||||
| Shares issued, ESOP |
103 | 1,386 | 1,386 | ||||||||||||||||||||||||||||||||
| Stock-based compensation |
735 | 735 | |||||||||||||||||||||||||||||||||
| Tax benefit of stock-based compensation |
748 | 748 | |||||||||||||||||||||||||||||||||
| Dividends issued |
(5,566 | ) | (5,566 | ) | |||||||||||||||||||||||||||||||
| Comprehensive income: |
|||||||||||||||||||||||||||||||||||
| Net income |
22,131 | 22,131 | |||||||||||||||||||||||||||||||||
| Foreign currency translation adjustments |
1,089 | 1,089 | |||||||||||||||||||||||||||||||||
| Comprehensive income: |
23,220 | ||||||||||||||||||||||||||||||||||
| Balance, December 29, 2007 |
— | $ | — | 16,493 | $ | 16 | $ | 34,390 | $ | — | $ | 51,844 | $ | 5,632 | $ | — | $ | 91,882 | |||||||||||||||||
The accompanying Notes to the Consolidated Financial Statements are an integral part of these financial statements.
33
Consolidated Statements of Cash Flows
(in thousands)
| For the year ended | ||||||||||||
| December 29, 2007 | December 30, 2006 | December 31, 2005 | ||||||||||
| Cash flows from operating activities: |
||||||||||||
| Net income |
$ | 22,131 | $ | 16,223 | $ | 12,808 | ||||||
| Adjustments to reconcile net income to net cash provided by operating activities: |
||||||||||||
| Depreciation and amortization |
6,341 | 5,849 | 5,604 | |||||||||
| (Gain) loss on disposal of assets |
(74 | ) | 12 | 22 | ||||||||
| Stock-based compensation expense |
735 | 573 | 365 | |||||||||
| Stock options income tax benefit |
(748 | ) | (381 | ) | — | |||||||
| Allowance for doubtful accounts |
75 | 30 | (60 | ) | ||||||||
| Provision for slow moving inventory |
251 | 157 | (96 | ) | ||||||||
| Provision for deferred income taxes |
575 | 326 | (688 | ) | ||||||||
| (Increase) decrease in: |
||||||||||||
| Accounts receivable |
(3,187 | ) | (2,972 | ) | (2,304 | ) | ||||||
| Inventories |
(1,286 | ) | (2,673 | ) | (669 | ) | ||||||
| Income tax receivable |
— | 236 | (236 | ) | ||||||||
| Other current assets |
(224 | ) | (122 | ) | (88 | ) | ||||||
| Other assets, net |
(310 | ) | (29 | ) | 39 | |||||||
| Increase (decrease) in: |
||||||||||||
| Accounts payable |
856 | (10 | ) | 2,286 | ||||||||
| Accrued expenses and other liabilities |
2,184 | 1,385 | 306 | |||||||||
| Income taxes payable |
814 | 989 | (261 | ) | ||||||||
| Other noncurrent liabilities |
108 | 17 | (19 | ) | ||||||||
| Net cash from operating activities |
28,241 | 19,610 | 17,009 | |||||||||
| Cash flows from investing activities: |
||||||||||||
| Investment in WhiteOak |
— | — | (400 | ) | ||||||||
| Investment in High Country Tek |
(2,375 | ) | — | — | ||||||||
| Capital expenditures |
(12,591 | ) | (9,525 | ) | (8,813 | ) | ||||||
| Proceeds from dispositions of equipment |
192 | 28 | 5 | |||||||||
| Net cash used in investing activities |
(14,774 | ) | (9,497 | ) | (9,208 | ) | ||||||
| Cash flows from financing activities: |
||||||||||||
| Proceeds from debt |
— | 7,000 | 11,599 | |||||||||
| Repayment of debt |
(371 | ) | (8,312 | ) | (21,469 | ) | ||||||
| Proceeds from exercise of stock options |
287 | 162 | 2,487 | |||||||||
| Stock options income tax benefit |
748 | 381 | — | |||||||||
| Proceeds from stock issued |
272 | 238 | 157 | |||||||||
| Payments for purchase of treasury stock |
— | (2,951 | ) | (1,588 | ) | |||||||
| Dividends to shareholders |
(5,167 | ) | (4,349 | ) | (2,701 | ) | ||||||
| Net cash used in financing activities |
(4,231 | ) | (7,831 | ) | (11,515 | ) | ||||||
| Effect of exchange rate changes on cash and cash equivalents |
604 | 1,385 | (218 | ) | ||||||||
| Net (decrease) increase in restricted cash |
28 | (295 | ) | (49 | ) | |||||||
| Net (decrease) increase in cash and cash equivalents |
9,812 | 3,962 | (3,883 | ) | ||||||||
| Cash and cash equivalents, beginning of period |
9,497 | 5,830 | 9,762 | |||||||||
| Cash and cash equivalents, end of period |
$ | 19,337 | $ | 9,497 | $ | 5,830 | ||||||
| Supplemental disclosure of cash flow information: |
||||||||||||
| Cash paid: |
||||||||||||
| Interest |
$ | 51 | $ | 312 | $ | 441 | ||||||
| Income taxes |
$ | 11,599 | $ | 7,510 | $ | 8,451 | ||||||
| Supplemental disclosure of noncash transactions: |
||||||||||||
| Common stock issued to ESOP through accrued expenses and other liabilities |
$ | 1,386 | $ | 1,183 | $ | 1,058 | ||||||
The accompanying Notes to the Consolidated Financial Statements are an integral part of these financial statements.
34
NOTES TO THE CONSOLIDATED FINANCIAL STATEMENTS
(in thousands, except per share data)
| 1. | BUSINESS |
Sun Hydraulics Corporation, and its wholly-owned subsidiaries and joint ventures, design, manufacture, and sell screw-in cartridge valves and manifolds used in hydraulic systems. The Company has facilities in the United States, the United Kingdom, Germany, Korea, France, and China. Sun Hydraulics Corporation (“Sun Hydraulics”), with its main offices located in Sarasota, Florida, designs, manufactures, and sells primarily through distributors. Sun Hydraulik Holdings Limited (“Sun Holdings”), a wholly-owned subsidiary of Sun Hydraulics, was formed to provide a holding company for the European market operations; its wholly-owned subsidiaries are Sun Hydraulics Limited (a British corporation, “Sun Ltd.”) and Sun Hydraulik GmbH (a German corporation, “Sun GmbH”). Sun Ltd. operates a manufacturing and distribution facility located in Coventry, England, and Sun GmbH operates a manufacturing and distribution facility located in Erkelenz, Germany. Sun Hydraulics Korea Corporation (“Sun Korea”), a wholly-owned subsidiary of Sun Hydraulics, located in Inchon, South Korea, operates a manufacturing and distribution facility. Sun Hydraulics, SARL (“Sun France”), a wholly-owned subsidiary of Sun Hydraulics, located in Bordeaux, France, operates a sales and engineering support facility. Sun Hydraulics Systems (Shanghai) Co., Ltd. (“Sun China”), a 50/50 joint venture between Sun Hydraulics and Links Lin, the owner of Sun Hydraulics’ Taiwanese distributor, is located in Shanghai, China, and operates a manufacturing and distribution facility. WhiteOak Controls, Inc. (“WhiteOak”), a 40% equity method investment, located in Mediapolis, Iowa, designs and produces complementary electronic control products. Sun Hydraulics acquired a 48% equity method investment in High Country Tek, Inc.(“HCT”), on November 30, 2007 (see Note 3). HCT, located in Nevada City, California, designs and manufacturers ruggedized electronic/hydraulic control solutions for mobile equipment markets. Sun Hydraulics opened a sales office in Bangalore, India during 2007 to develop new business opportunities in the Indian market.
| 2. | SUMMARY OF SIGNIFICANT ACCOUNTING POLICIES |
A summary of the significant accounting policies followed in the preparation of the Company’s consolidated financial statements is set forth below:
Principles of Consolidation
The consolidated financial statements include the accounts and operations of Sun Hydraulics and its direct and indirect subsidiaries. All significant intercompany accounts and transactions are eliminated in consolidation. The Company uses the equity method of accounting for its investments in Sun China, WhiteOak, and HCT. The Company does not have a majority ownership in or exercise control over these entities.
Critical Accounting Policies and Estimates
The Company currently only applies judgment and estimates, which may have a material effect on the eventual outcome of assets, liabilities, revenues and expenses, for impairment of long-lived assets, accounts receivable, inventory, goodwill and accruals. The following explains the basis and the procedure for each account where judgment and estimates are applied.
Revenue Recognition
The Company reports revenues, net of sales incentives, when title passes and risk of loss transfers to the customer. The effect of material non-recurring events is provided for when they become known.
Impairment of Long-Lived Assets
In accordance with Statement of Financial Accounting Standards (“SFAS”) No. 144, Accounting for Impairment or Disposal of Long-lived Assets (“SFAS 144”), long-lived assets, such as property and equipment, and purchased intangibles subject to amortization, are reviewed for impairment whenever events or changes in circumstances indicate that the carrying amount of an asset may not be recoverable. Recoverability of the asset is measured by comparison of its carrying amount to future net cash flows the asset is expected to generate. If such assets are considered to be impaired, the impairment to be recognized is measured as the amount by which the carrying amount of the asset exceeds its fair market value.
The Company assesses the recoverability of goodwill and intangible assets not subject to amortization under SFAS No. 142, Goodwill and Other Intangible Assets (“SFAS 142”). See Goodwill below.
Accounts Receivable
The Company sells to most of its customers on a recurring basis, primarily through distributors with which the
35
Company maintains long-term relationships. As a result, bad debt experience has not been material. The allowance for doubtful accounts is determined on a specific identification basis by a review of those accounts that are significantly in arrears. There can be no assurance that a distributor or a large direct sale customer with overdue accounts receivable balances will not develop financial difficulties and default on payment. See the consolidated balance sheets for allowance amounts.
Inventory
The Company offers a wide variety of standard products and as a matter of policy does not discontinue products. On an ongoing basis, component parts found to be obsolete through design or process changes are disposed of and charged to material cost. The Company reviews on-hand balances of products and component parts against specific criteria. Products and component parts without usage or that have excess quantities on hand are evaluated. An inventory reserve is then established for the full inventory carrying value of those products and component parts deemed to be obsolete or slow moving. See Note 6 to the Financial Statements for inventory reserve amounts.
Goodwill
The Company acquired its Korean operations in September 1998 using the purchase method. As a result, goodwill is reflected on the consolidated balance sheet. A valuation based on the cash flow method was performed at December 29, 2007 and December 30, 2006. It was determined that the value of the goodwill was not impaired. There is no assurance that the value of the acquired company will not decrease in the future due to changing business conditions. See Note 8 to the Financial Statements for goodwill amounts.
Accruals
The Company makes estimates related to certain employee benefits and miscellaneous accruals. Estimates for employee benefit accruals are based on information received from plan administrators in conjunction with management’s assessments of estimated liabilities related to workers’ compensation, health care benefits and annual contributions to an employee stock ownership plan (“ESOP”), established in 2004 as part of the Company’s retirement plan. Estimates for miscellaneous accruals are based on management’s assessment of estimated liabilities for costs incurred.
As of July 1, 2003, the Company accrues for health care benefit costs under a self-funded plan utilizing estimates provided by a third party administrator and insurance company. The Company purchases re-insurance for both specific and aggregate stop losses on claims that exceed $100,000 on an individual basis and approximately $5.8 million on an aggregate basis.
Stock Split
On June 19, 2007, the Company declared a three-for-two stock split, effected in the form of a 50% stock dividend, to shareholders of record on June 30, 2007, payable on July 15, 2007. The Company issued approximately 5,500,000 shares of common stock as a result of the stock split. The effect of the stock split on outstanding shares, earnings per share and dividends per share has been retroactively applied to all periods presented.
On June 10, 2005, the Company declared a three-for-two stock split, effected in the form of a 50% stock dividend, to shareholders of record on June 30, 2005, payable on July 15, 2005. The Company issued approximately 3,600,000 shares of common stock as a result of the stock split. The effect of the stock split on outstanding shares, earnings per share and dividends per share has been retroactively applied to all periods presented.
Reclassification
Certain amounts shown in the 2006 consolidated financial statements have been reclassified to conform to the 2007 presentation. 2005 amounts were not material to the consolidated financial statements.
Management Estimates and Assumptions
The preparation of financial statements in conformity with accounting principles generally accepted in the United States of America requires management to make estimates and assumptions that affect the reported amounts of assets and liabilities and disclosure of contingent assets and liabilities at the date of the financial statements and the reported amounts of revenues and expenses during the reporting period. Actual results could differ from those estimates.
36
52-53 Week Fiscal Year
The Company reports on a fiscal year that ends on the Saturday closest to December 31st. Each quarter generally consists of two 4-week periods and one 5-week period. As a result of the 2005 fiscal year ending December 31, 2005, the quarter-ended April 2, 2005 consisted of one 4-week period and two 5-week periods, resulting in a 53-week year.
Cash and Cash Equivalents
The Company considers all short-term highly liquid investments purchased with an original maturity of three months or less to be cash equivalents.
Inventories
Inventories are valued at the lower of cost or market, cost being determined on a first-in, first-out basis. Obsolete and slow moving inventory is evaluated and reserves are established based on specific criteria determined by management.
Property, Plant and Equipment
Property, plant and equipment is stated at cost. Expenditures for repairs and improvements that significantly add to the productive capacity or extend the useful life of an asset are capitalized. Repairs and maintenance are expensed as incurred. Depreciation is computed using the straight line method over the following useful lives:
| Years | ||
| Computer equipment |
3 -5 | |
| Machinery and equipment |
4 -12 | |
| Furniture and fixtures |
4 -10 | |
| Leasehold and land improvements |
5 -15 | |
| Buildings |
40 |
Gains or losses on the retirement, sale, or disposition of property, plant, and equipment are reflected in the Consolidated Statement of Operations in the period in which the assets are taken out of service.
Valuation Assessment of Long-Lived Assets
Management periodically evaluates long-lived assets for potential impairment and will provide for impairment whenever events or changes in circumstances indicate the carrying amount of the assets may not be fully recoverable. Assets are reviewed for utilization on a monthly basis by management in conjunction with employees who work directly with the assets.
Goodwill
Goodwill, which represents the excess of the purchase price of acquisition over the fair value of the net assets acquired and other acquisition costs, is carried at cost. In accordance with SFAS 142, goodwill is not amortized by the Company. Instead, SFAS 142 requires goodwill to be reviewed for impairment on an annual basis, or more frequently if events or circumstances indicate possible impairment.
Other Assets
Other assets consist of equity investments in the Company’s joint ventures in Sun China, WhiteOak and HCT. The equity investments were recorded at cost and have been adjusted for investment income or loss and dividend distributions for each quarterly period since their origin.
Revenue Recognition
Sales are recognized when products are shipped and title to the products is passed to the customer. Sales incentives are granted to customers based upon the volume of purchases. These sales incentives are recorded at the time of sales as a reduction of gross sales.
Shipping and Handling Costs
Shipping and handling costs billed to distributors and customers are recorded in revenue. Shipping costs incurred by the Company are recorded in cost of goods sold.
Foreign Currency Translation and Transactions
The Company follows the translation policy provided by SFAS No. 52, Foreign Currency Translation. The Pound Sterling is the functional currency of Sun Ltd. The Euro is the functional currency of Sun GmbH. The South Korean Won is the functional currency of Sun Korea. The U.S. Dollar is the functional currency for Sun Hydraulics and the reporting currency for the consolidated group. The assets and liabilities of Sun Ltd., Sun GmbH, and Sun Korea are
37
translated at the exchange rate in effect at the balance sheet date, and income and expense items are translated at the average annual rate of exchange for the period. The resulting unrealized translation gains and losses are included as a component of shareholders’ equity designated as “accumulated other comprehensive income.” Realized gains and losses from foreign currency transactions are included in the Consolidated Statement of Operations.
Income Taxes
The Company follows the income tax policy provided by SFAS No. 109, Accounting for Income Taxes (“SFAS 109”). This Statement provides for a liability approach under which deferred income taxes are provided for based upon enacted tax laws and rates applicable to the periods in which the taxes become payable. These differences result from items reported differently for financial reporting and income tax purposes, primarily depreciation, accrued expenses and reserves.
In July 2006, the FASB issued FIN 48, Accounting for Uncertainty in Income Taxes, and Related Implementation Issues (“FIN 48”). FIN 48 clarifies the accounting for uncertainty in income taxes recognized in a Company’s financial statements in accordance with FASB No. 109, Accounting for Income Taxes. FIN 48 prescribes a recognition threshold and measurement attribute for a tax position taken or expected to be taken in a tax return. FIN 48 also provides guidance on derecognition, classification, interest and penalties, accounting in interim periods, disclosure, and transition. The Company adopted FIN 48 effective January 1, 2007. The adoption of FIN 48 did not have a material effect on the Company’s Consolidated Financial Statements. The Company had unrecognized tax benefits of $208 and $34, including accrued interest, at January 1, 2007, and December 29, 2007, respectively. See Note 13 to the Financial Statements for tax amounts.
Stock-Based Compensation
Effective January 1, 2006, the Company adopted the provisions of Statement of Financial Accounting Standard (“SFAS”) No. 123R, Share-Based Payment, (“SFAS 123R”) for its share-based compensation plans. The Company previously accounted for these plans under the recognition and measurement principles of Accounting Principles Board Opinion No. 25, Accounting for Stock Issued to Employees, (“APB 25”) and related interpretations and disclosure requirements established by SFAS No. 123, Accounting for Stock-Based Compensation, (“SFAS 123”), as amended by SFAS No. 148, Accounting for Stock-Based Compensation – Transition and Disclosure.
Under APB 25, no compensation expense was recorded in earnings for the Company’s stock options and awards granted under the Company’s employee stock purchase plan (“ESPP”). The pro forma effects on net income and earnings per share for stock options were instead disclosed in a footnote to the financial statements. Compensation expense was recorded in earnings for restricted stock awards. Under SFAS 123R, all share-based compensation cost is measured at the grant date, based on the fair value of the award, and is recognized as an expense in earnings over the requisite service period.
The Company adopted SFAS 123R using the modified prospective method. Under this transition method, compensation cost recognized in fiscal years 2007 and 2006, includes the cost for all share-based awards granted prior to, but not yet vested as of January 1, 2006. This cost was based on the grant-date fair value estimated in accordance with the original provisions of SFAS 123. Results for prior periods have not been restated.
The compensation cost for stock options will be based on the grant-date fair value of those awards as calculated using the Black-Scholes valuation model. Compensation for restricted stock awards is measured at fair value on the date of grant based on the number of shares expected to vest and the quoted market price of the Company’s common stock. Compensation cost for stock options and restricted stock awards is recognized in earnings, net of estimated forfeitures, on a straight-line basis over the requisite service period. Compensation cost for shares granted under the ESPP is calculated based on actual quarterly purchases.
Prior to the adoption of SFAS 123R, benefits of tax deductions in excess of recognized compensation costs were reported as operating cash flows. SFAS 123R requires excess tax benefits be reported as a financing cash inflow rather than as a reduction of taxes paid.
| 3. | ACQUISITIONS |
On November 30, 2007, Sun Hydraulics acquired shares of preferred and common stock totaling 48% of the outstanding shares of HCT. HCT designs and manufacturers ruggedized electronic/hydraulic control solutions for mobile equipment markets; products include digital valve controllers, designed specifically for the hydraulic industry, and a patented suite of software products called Intella(TM). The products’ modular architecture allows customers to add functionality, reliability, and precision, while preserving their investment in prior application development. HCT complements the Company’s electro-hydraulic efforts, including its earlier investment in WhiteOak Controls. The
38
acquisition price paid by the Company was $2,375. The excess paid over pro rata share of net assets of $1,363 is for developed technology, which is included within the investment account, and is being amortized over a period of 10 years. Sun Hydraulics will have the option to purchase the remaining outstanding stock of HCT after December 31, 2009, at a purchase price that will approximate fair market value.
| 4. | FAIR VALUE OF FINANCIAL INSTRUMENTS |
The fair value of a financial instrument is the amount at which the instrument could be exchanged in a current transaction between willing parties, other than in a forced sale or liquidation. The following methods and assumptions were used to estimate the fair value of each class of financial instruments.
The carrying amounts of cash and cash equivalents, restricted cash, accounts receivable, other current assets, accounts payable, accrued expenses and other liabilities approximate fair value based on their short-term status.
The carrying amount of long-term debt approximates fair value, as the interest rates on the debt approximate rates currently available to the Company for debt with similar terms and remaining maturities.
| 5. | RESTRICTED CASH |
On December 29, 2007 and December 30, 2006, the Company had restricted cash of $146 and $118, respectively. $60 of the 2007 restricted cash balance and the total 2006 restricted cash balance consisted of reserves for customs and excise taxes in the U.K. operation. The restricted amount was calculated as an estimate of two months of customs and excise taxes for items coming into the Company’s U.K. operations and was held with Lloyd’s TSB in the U.K. The remaining 2007 amount of $86 relates to a guarantee of VAT in our France operation. The guarantee is held with Crédit Agricole Bank in France.
| 6. | INVENTORIES |
| December 29, 2007 | December 30, 2006 | |||||||
| Raw materials |
$ | 4,577 | $ | 3,585 | ||||
| Work in process |
3,863 | 3,481 | ||||||
| Finished goods |
3,627 | 3,715 | ||||||
| Provision for slow moving inventory |
(646 | ) | (395 | ) | ||||
| Total |
$ | 11,421 | $ | 10,386 | ||||
| 7. | PROPERTY, PLANT, and EQUIPMENT |
| December 29, 2007 | December 30, 2006 | |||||||
| Machinery and equipment |
$ | 69,152 | $ | 60,244 | ||||
| Office furniture and equipment |
10,475 | 9,008 | ||||||
| Buildings |
26,635 | 25,477 | ||||||
| Leasehold and land improvements |
1,816 | 1,797 | ||||||
| Land |
2,974 | 2,940 | ||||||
| $ | 111,052 | $ | 99,466 | |||||
| Less: Accumulated depreciation |
(59,910 | ) | (55,557 | ) | ||||
| Construction in progress |
5,857 | 6,446 | ||||||
| Total |
$ | 56,999 | $ | 50,355 | ||||
Depreciation expense for the years ended December 29, 2007, December 30, 2006, and December 31, 2005 totaled $6,314, $5,822, and $5,591, respectively.
| 8. | GOODWILL |
On December 29, 2007 and December 30, 2006, the Company had $715 of goodwill related to its acquisition of Sun Korea.
39
Valuation models reflecting the expected future cash flow projections were used to value Sun Korea at December 29, 2007 and December 30, 2006. The analysis indicated that there was no impairment of the carrying value of the goodwill.
| 9. | OTHER ASSETS |
| December 29, 2007 | December 30, 2006 | |||||
| Goodwill |
$ | 715 | $ | 715 | ||
| Equity investment in joint venture |
||||||
| Sun China |
874 | 555 | ||||
| WhiteOak Controls, Inc. |
64 | 80 | ||||
| High Country Tek, Inc. |
2,325 | — | ||||
| Loan acquisition costs, net of amortization of $66 and $37 |
104 | 133 | ||||
| Developed technology, net of accumulated amortization of $67 and $40 |
203 | 230 | ||||
| Deposits with suppliers |
166 | 73 | ||||
| Other |
32 | 39 | ||||
| Total |
$ | 4,483 | $ | 1,825 | ||
| 10. | ACCRUED EXPENSES AND OTHER LIABILITIES |
| December 29, 2007 | December 30, 2006 | |||||
| Compensation and benefits |
$ | 3,058 | $ | 2,353 | ||
| Insurance |
1,006 | 866 | ||||
| Other |
793 | 840 | ||||
| Total |
$ | 4,857 | $ | 4,059 | ||
| 11. | LONG-TERM DEBT |
| December 29, 2007 | December 30, 2006 | |||||||
| $35,000 revolving line of credit, collateralized by U.S. assets, interest rate Libor + 1.5% or Bank’s Base Rate at Company’s discretion ( 6.73% at December 29, 2007), due August 1, 2011. |
$ | — | $ | — | ||||
| $2,400 12-year mortgage note on the German facility, fixed interest rate of 6.05%, due September 30, 2008. |
260 | 464 | ||||||
| 10-year notes, fixed interest rates ranging from 3.5-5.1%, collateralized by equipment in Germany, due between 2009 and 2011. |
441 | 593 | ||||||
| Other |
— | 15 | ||||||
| 701 | 1,072 | |||||||
| Less amounts due within one year |
(417 | ) | (426 | ) | ||||
| Total |
$ | 284 | $ | 646 | ||||
The remaining principal payments are due as follows: 2008—$417; 2009—$154; 2010—$97; 2011—$33.
On August 11, 2005, the Company completed a refinancing of its existing debt in the U.S. with Fifth Third Bank (the “Bank”). The new financing consists of a secured revolving line of credit of $35 million (the “Line of Credit”). The Line of Credit is secured by the Company’s U.S. assets, including its manufacturing facilities, and requires monthly
40
payments of interest. The Line of Credit has a floating interest rate based upon the Company’s leverage ratio. The Line of Credit is payable in full on August 1, 2011, but maturity may be accelerated by the Bank upon an Event of Default (as defined). Prepayment may be made without penalty or premium at any time upon the required notice to the Bank. At December 29, 2007, there was no outstanding balance on the Line of Credit.
The Line of Credit is subject to debt covenants including: 1) Debt (as defined) to Tangible Net Worth (as defined) ratio of not more than 1.5:1.0, 2) Funded Debt (as defined) to EBITDA (as defined) ratio of not more than 2.5:1.0, and 3) EBIT (as defined) to Interest Expense (as defined) ratio of not less than 1.1:1.0; and requires the Company to maintain its primary domestic deposit accounts with the Bank. As of December 29, 2007, the Company was in compliance with all debt covenants.
| 12. | DIVIDENDS TO SHAREHOLDERS |
The Company declared dividends of $5,566, $4,345, and $3,269 to shareholders in 2007, 2006, and 2005, respectively.
The Company declared the following quarterly dividends to shareholders of record on the last day of the respective quarter:
| 2007 | 2006 | 2005 | |||||||
| First quarter |
$ | 0.067 | $ | 0.067 | $ | 0.033 | |||
| Second quarter |
0.090 | 0.067 | 0.033 | ||||||
| Third quarter |
0.090 | 0.067 | 0.067 | ||||||
| Fourth quarter |
0.090 | 0.067 | 0.067 | ||||||
These dividends were paid on the 15th day of each month following the date of declaration. In addition, the Company declared 50% stock dividends on June 30, 2005, and June 30, 2007.
41
| 13. | INCOME TAXES |
Deferred income tax assets and liabilities are provided to reflect the future tax consequences of differences between the tax basis of assets and liabilities and their reported amounts in the financial statements.
For financial reporting purposes, income before income taxes includes the following components:
| For the year ended | |||||||||
| December 29, 2007 |
December 30, 2006 |
December 31, 2005 | |||||||
| United States |
$ | 22,789 | $ | 16,341 | $ | 12,827 | |||
| Foreign |
11,582 | 8,562 | 6,310 | ||||||
| Total |
$ | 34,371 | $ | 24,903 | $ | 19,137 | |||
The components of the income tax provision (benefit) are as follows:
| For the year ended | ||||||||||||
| December 29, 2007 |
December 30, 2006 |
December 31, 2005 |
||||||||||
| Current tax expense: |
||||||||||||
| United States |
$ | 7,853 | $ | 5,355 | $ | 5,038 | ||||||
| State and local |
464 | 269 | 158 | |||||||||
| Foreign |
3,348 | 2,730 | 1,821 | |||||||||
| Total current |
11,665 | 8,354 | 7,017 | |||||||||
| Deferred tax expense (benefit): |
||||||||||||
| United States |
217 | 324 | (601 | ) | ||||||||
| State and local |
(4 | ) | (7 | ) | (136 | ) | ||||||
| Foreign |
362 | 9 | 49 | |||||||||
| Total deferred |
575 | 326 | (688 | ) | ||||||||
| Total income tax provision |
$ | 12,240 | $ | 8,680 | $ | 6,329 | ||||||
The reconciliation between the effective income tax rate and the U.S. federal statutory rate is as follows:
| For the year ended | ||||||||||||
| December 29, 2007 |
December 30, 2006 |
December 31, 2005 |
||||||||||
| U.S. federal taxes at statutory rate |
$ | 12,043 | $ | 8,467 | $ | 6,507 | ||||||
| Increase (decrease) |
||||||||||||
| Net residual tax on foreign distributions |
— | 169 | 264 | |||||||||
| Foreign tax credit |
(27 | ) | — | — | ||||||||
| Benefit of ETI exclusion |
— | (217 | ) | (170 | ) | |||||||
| Domestic production activity deduction |
(381 | ) | (110 | ) | (121 | ) | ||||||
| Foreign income taxed at lower rate |
(344 | ) | (172 | ) | (64 | ) | ||||||
| Change in foreign valuation allowance |
— | — | (212 | ) | ||||||||
| Nondeductible items |
116 | — | — | |||||||||
| Benefit of state rate change |
— | — | (118 | ) | ||||||||
| Effect of federal rate change |
106 | — | — | |||||||||
| State and local taxes, net |
460 | 262 | 139 | |||||||||
| Change in reserve |
(174 | ) | — | — | ||||||||
| Korea withholding tax |
107 | — | — | |||||||||
| Other |
334 | 281 | 104 | |||||||||
| Income tax provision |
$ | 12,240 | $ | 8,680 | $ | 6,329 | ||||||
42
Deferred income taxes reflect the net tax effects of temporary differences between the carrying amounts of assets and liabilities for financial reporting purposes and the amounts used for income taxes. The temporary differences that give rise to significant portions of the deferred tax assets and liabilities as of December 29, 2007 and December 30, 2006 are presented below:
| December 29, 2007 |
December 30, 2006 |
|||||||
| Deferred tax assets: |
||||||||
| Current: |
||||||||
| Accrued expenses and other |
$ | 301 | $ | 219 | ||||
| Foreign tax credit carryforward |
— | — | ||||||
| Deferred royalty income |
— | — | ||||||
| Total current deferred tax assets |
301 | 219 | ||||||
| Noncurrent: |
||||||||
| Accrued expenses and other |
57 | 88 | ||||||
| Deferred royalty income |
47 | 64 | ||||||
| Total noncurrent deferred tax assets |
104 | 152 | ||||||
| Deferred tax liabilities: |
||||||||
| Noncurrent: |
||||||||
| Depreciation |
(5,137 | ) | (4,521 | ) | ||||
| Other |
(75 | ) | (82 | ) | ||||
| Total noncurrent deferred tax liabilities |
(5,212 | ) | (4,603 | ) | ||||
| Net noncurrent deferred tax liability |
$ | (5,108 | ) | $ | (4,451 | ) | ||
A valuation allowance to reduce the deferred tax assets reported is required if, based on the weight of the evidence, it is more likely than not that some portion or all of the deferred tax assets will not be realized. For the fiscal years ended 2007 and 2006, management has determined that a valuation allowance is not required.
The Company intends to indefinitely reinvest the earnings of its non-U.S. subsidiaries, which reflect full provision for non-U.S. income taxes, to expand its international operations. These earnings relate to ongoing operations and, at December 29, 2007, cumulative earnings were approximately $25 million. Accordingly, no provision has been made for U.S. income taxes that might be payable upon repatriation of such earnings. In the event any earnings of non-U.S. subsidiaries are repatriated, the Company will provide U.S. income taxes upon repatriation of such earnings, which will be offset by applicable foreign tax credits, subject to certain limitations. During the year ended December 30, 2006, the Company repatriated $5.0 million, from its foreign subsidiaries. U.S. income taxes due based on the repatriations have been provided for in the above income tax provisions.
In July 2006, the FASB issued FIN 48, Accounting for Uncertainty in Income Taxes, and Related Implementation Issues (“FIN 48”). FIN 48 clarifies the accounting for uncertainty in income taxes recognized in a Company’s financial statements in accordance with FASB No. 109, Accounting for Income Taxes. FIN 48 prescribes a recognition threshold and measurement attribute for a tax position taken or expected to be taken in a tax return. FIN 48 also provides guidance on derecognition, classification, interest and penalties, accounting in interim periods, disclosure, and transition. The Company adopted FIN 48 effective January 1, 2007. The adoption of FIN 48 did not have a material effect on the Company’s Consolidated Financial Statements.
43
The following is a roll-forward of the Company’s unrecognized tax benefits:
| Unrecognized tax benefits - January 1, 2007 | $ | 208 | ||
| Increases from positions taken during prior periods |
34 | |||
| Lapse of statute of limitations |
(208 | ) | ||
| Unrecognized tax benefits - December 29, 2007 | $ | 34 | ||
As of January 1, 2007, the Company had an unrecognized tax benefit of $208 including accrued interest. During 2007, the Company recognized the tax benefit of $208, which had a favorable effect on the effective tax rate for the periods ended December 29, 2007.
At December 29, 2007, the Company had an unrecognized tax benefit of $34 including accrued interest. If recognized, the unrecognized tax benefit would have a favorable effect on the effective tax rate in future periods. The Company recognizes interest and penalties related to income tax matters in income tax expense. Interest related to the unrecognized tax benefit has been recognized and included in income tax expense. Interest accrued as of December 29, 2007, is not considered material to the Company’s Consolidated Financial Statements.
The Company files U.S. federal income tax returns as well as income tax returns in various states and foreign jurisdictions. The Company is no longer subject to income tax examinations by tax authorities for years before 2004 for the majority of tax jurisdictions.
| 14. | STOCK OPTION PLANS |
The following table illustrates the effect on net income and earnings per share as if the Company had applied the fair-value recognition provisions of SFAS 123 to all of its share-based compensation awards for periods prior to the adoption of SFAS 123R. The fair value of each option grant is estimated on the date of grant using the Black-Scholes option pricing model with weighted average assumptions as set forth below.
| December 31, 2005 |
||||
| Net Income as Reported | $ | 12,808 | ||
| Stock-based compensation reported in net income, net of related taxes | 215 | |||
| Stock compensation expense calculated under FAS 123, net of related taxes | (336 | ) | ||
| Pro Forma Net Income | $ | 12,687 | ||
| Basic net income per common share: | ||||
| As reported |
$ | 0.79 | ||
| Pro forma |
$ | 0.78 | ||
| Diluted net income per common share: | ||||
| As reported |
$ | 0.78 | ||
| Pro forma |
$ | 0.77 | ||
| Assumptions | ||||
| Risk-free interest rate |
4.54 | % | ||
| Expected lives (in years) |
6.5 | |||
| Expected volatility |
35.71 | % | ||
| Dividend yield |
1.83 | % | ||
During 1996, the Company adopted the 1996 Stock Option Plan (the “Stock Option Plan”), which provides for the grant of incentive stock options and nonqualified stock options for the purchase of up to an aggregate of 2,250,000 shares of the Company’s common stock by officers, employees and directors of the Company. Under the terms of the plan, incentive stock options may be granted to employees at an exercise price per share of not less than the
44
fair value per common share on the date of the grant (not less than 110% of the fair value in the case of holders of more than 10% of the Company’s voting stock). Nonqualified stock options may be granted at the discretion of the Company’s Board of Directors. The maximum term of an option may not exceed 10 years, and options become exercisable at such times and in such installments as determined by the Board of Directors.
A summary of the Company’s stock option plan for the years ended December 29, 2007, December 30, 2006, and December 31, 2005 is summarized as follows:
| Number of shares |
Exercise price range |
Weighted average exercise price | |||||||||||
| (share amounts are in thousands) | |||||||||||||
| Under option, December 25, 2004 (503 shares exercisable) |
709 | $ | 2.67 | – | 7.44 | $ | 4.34 | ||||||
| Granted |
6 | $ | 12.27 | – | 12.27 | $ | 12.27 | ||||||
| Exercised |
(555 | ) | $ | 2.67 | – | 7.45 | $ | 4.47 | |||||
| Forfeitures |
— | ||||||||||||
| Under option, December 31, 2005 (61 shares exercisable) |
160 | $ | 3.00 | – | 12.27 | $ | 4.24 | ||||||
| Granted |
— | $ | — | – | — | $ | — | ||||||
| Exercised |
(45 | ) | $ | 3.00 | – | 5.49 | $ | 3.61 | |||||
| Forfeitures |
(2 | ) | $ | 5.49 | – | 5.49 | $ | 5.49 | |||||
| Under option, December 30, 2006 (84 shares exercisable) |
113 | $ | 3.00 | – | 12.27 | $ | 4.47 | ||||||
| Granted |
— | $ | — | – | — | $ | — | ||||||
| Exercised |
(72 | ) | $ | 3.00 | – | 12.27 | $ | 3.97 | |||||
| Forfeitures |
(5 | ) | $ | 3.11 | – | 5.49 | $ | 3.39 | |||||
| Under option, December 29, 2007 (32 shares exercisable) |
36 | $ | 3.00 | – | 12.27 | $ | 5.62 | ||||||
All options listed above vest over three to five years with a maximum term of seven to ten years.
A summary of outstanding and exercisable options at December 29, 2007 is summarized as follows:
| Options Outstanding | Options Exercisable | ||||||||||
| Weighted-average | Weighted | ||||||||||
| Range of | Number of | Remaining | Exercise | Number of | average | ||||||
| exercise prices |
shares | contractual life | price | shares | exercise price | ||||||
| $ | 3.00 | 10 | 2.83 | 3.00 | 10 | 3.00 | |||||
| 3.11 | 1 | 3.83 | 3.11 | 1 | 3.11 | ||||||
| 3.15 | 2 | 2.75 | 3.15 | 2 | 3.15 | ||||||
| 5.49 | 18 | 3.75 | 5.49 | 18 | 5.49 | ||||||
| 12.27 | 5 | 4.92 | 12.27 | 1 | 12.27 | ||||||
The weighted average estimated fair value of stock options granted during 2005 was $4.45 per share, respectively. There were no stock options granted during 2007 and 2006.
In September 2006, the Company adopted the 2006 Stock Option Plan (“2006 Plan”), which provides for the grant of incentive stock options and nonqualified stock options for the purchase of up to an aggregate of 750,000 shares of the Company’s common stock by officers, employees and directors of the Company. The Company adopted the 2006 Plan due to the expiration of the Company’s 1996 Stock Option Plan in 2006. Under the terms of the plan, incentive stock options may be granted to employees at an exercise price per share of not less than the fair value per common share on the date of the grant (not less than 110% of the fair value in the case of holders of more than 10% of the Company’s voting stock). Nonqualified stock options may be granted at the discretion of the Company’s Board of Directors. The maximum term of an option may not exceed 10 years, and options become exercisable at such times and in such installments as determined by the Board of Directors. No awards have been granted under the 2006 Plan.
45
During 2001, the Company adopted the 2001 Restricted Stock Plan, which provides for the grant of restricted stock of up to an aggregate of 618,750 shares of the Company’s common stock to officers, employees, consultants and directors of the Company. Under the terms of the plan, the minimum period before any shares become non-forfeitable may not be less than six months. Restricted stock granted prior to January 1, 2006, was accounted for using the measurement and recognition principles of APB 25. Effective January 1, 2006, the company adopted the provisions of SFAS 123R. Accordingly, compensation cost has been measured at the date of the grant and is recognized in earnings over the period in which the shares vest. Restricted stock expense for the years ended December 29, 2007, December 30, 2006, and December 31, 2005 totaled $507, $413, and $342, respectively. At December 29, 2007, 167,589 shares remained available to be issued through the Restricted Stock Plan.
A summary of the Company’s restricted stock plan for the years ended December 29, 2007, December 30, 2006, and December 31, 2005 is summarized as follows:
| Number of shares |
Weighted average grant-date fair value | |||||
| Nonvested balance at December 25, 2004 |
194 | $ | 3.90 | |||
| Granted |
39 | 12.27 | ||||
| Vested |
(80 | ) | 3.77 | |||
| Forfeitures |
(11 | ) | 3.22 | |||
| Nonvested balance at December 31, 2005 |
142 | $ | 6.30 | |||
| Granted |
45 | 13.48 | ||||
| Vested |
(92 | ) | 4.92 | |||
| Forfeitures |
(3 | ) | 8.21 | |||
| Nonvested balance at December 30, 2006 |
92 | $ | 11.14 | |||
| Granted |
27 | 33.75 | ||||
| Vested |
(49 | ) | 9.40 | |||
| Forfeitures |
(2 | ) | 12.90 | |||
| Nonvested balance at December 29, 2007 |
68 | $ | 21.22 | |||
The Company has $1,276 of total unrecognized compensation cost related to restricted stock awards granted under the Plan as of December 29, 2007. That cost is expected to be recognized over a weighted average period of 1.82 years. Pursuant to SFAS 123R, the $741 of unearned compensation recorded as a reduction to stockholders’ equity as of December 31, 2005, was reversed against the Company’s additional paid-in-capital.
During 2001, the Company adopted the Employee Stock Purchase Plan (“ESPP”), which became effective August 1, 2001. Most employees are eligible to participate. Employees who choose to participate are granted an opportunity to purchase common stock at 85 percent of market value on the first or last day of the quarterly purchase period, whichever is lower. The ESPP authorizes the issuance, and the purchase by employees, of up to 731,250 shares of common stock through payroll deductions. No employee is allowed to buy more than $25,000 of common stock in any year, based on the market value of the common stock at the beginning of the purchase period. Employees purchased 17,987 shares at an average price of $15.10 and 20,684 shares at an average price of $11.38, under the ESPP during 2007 and 2006, respectively. The Company recognized $137 and $48 of compensation expense during 2007 and 2006, respectively, in accordance with SFAS 123R. At December 29, 2007, 583,742 shares remained available to be issued through the ESPP.
During 2004, the Board of Directors adopted and the shareholders approved the Nonemployee Director Equity and Deferred Compensation Plan (the “Plan”). Directors who are not officers of the Company are paid $4,000 for attendance at each meeting of the Board of Directors, as well as each meeting of each Board Committee on which they serve when the committee meeting is not held within one day of a meeting of the Board of Directors. Directors receive $1,500 of the $4,000 Director fee in shares of Company stock under the Plan. Directors also may elect under the Plan to receive all or part of the remainder of their fees in Company stock and to defer receipt of their fees until a subsequent year. The Plan authorizes the issuance of up to 120,000 shares of common stock.
On September 9, 2006, the board approved an increase in the total amount paid for each such meeting to $5,000, and also amended the 2004 Plan to make $2,500 of the $5,000 fee payable in shares of the company’s common
46
stock. Directors were granted 3,854 and 4,258 shares during 2007 and 2006, respectively. At December 29, 2007, there were 11,076 deferred stock units outstanding. Deferred stock units are treated as liabilities in accordance with SFAS 123R. At December 29, 2007, 161,614 shares remained available to be issued through the Plan.
| 15. | STOCK REPURCHASE PLANS |
In June 2006, the Company’s Board of Directors authorized the repurchase of up to $2.5 million of Company stock, to be completed no later than January 15, 2007. The stock purchases were made in the open market. Market purchases were made subject to restrictions relating to volume, price and timing in an effort to minimize the impact of the purchases on the market for the Company’s securities. The amount of the stock repurchased was used to continue to fund the Company’s employee stock ownership and employee stock purchase plans. Under the plan, which was completed in July, the Company had repurchased 203,073 shares at an average price of $12.31. All shares were retired during the year.
In December 2005, the Company’s Board of Directors authorized the repurchase of up to $2.0 million of Company stock, to be completed no later than January 15, 2007. The stock purchases were made in the open market. Market purchases were made subject to restrictions relating to volume, price and timing in an effort to minimize the impact of the purchases on the market for the Company’s securities. The amount of the stock repurchases was set based upon the anticipated number of shares that were required to fund the Company’s ESOP, and employee stock purchase plan, through fiscal year 2006. The Company had repurchased 123,750 shares at an average cost of $12.58 per share and 34,047 shares at an average cost of $13.01 for the periods ending December 31, 2005 and December 30, 2006, respectively. Of the 123,750 shares purchased in 2005, 97,500 were retired prior to December 31, 2005. All remaining shares and purchases were retired during 2006.
In November 2004, the Company’s Board of Directors authorized the repurchase of up to $2.5 million of Company stock, to be completed no later than January 15, 2006. The amount of the stock repurchases was set based upon the anticipated number of shares that were required to fund the Company’s ESOP, and employee stock purchase plan, through fiscal year 2005. The Company purchased 13,050 shares at an average cost of $6.35 per share and 4,050 shares at an average cost of $6.53 per share for the periods ending December 25, 2004 and December 31, 2005, respectively. The stock purchases were made in the open market. Market purchases were made subject to restrictions relating to volume, price and timing in an effort to minimize the impact of the purchases on the market for the Company’s securities. All shares were retired during the year of purchase.
| 16. | EARNINGS PER SHARE |
The following table represents the computation of basic and diluted net income per common share as required by SFAS No. 128 “Earnings Per Share” (in thousands, except per share data):
| December 29, 2007 |
December 30, 2006 |
December 31, 2005 | |||||||
| Net income |
$ | 22,131 | $ | 16,223 | $ | 12,808 | |||
| Basic weighted average number of common shares outstanding |
16,437 | 16,317 | 16,241 | ||||||
| Basic net income per common share |
$ | 1.35 | $ | 0.99 | $ | 0.79 | |||
| Effect of dilutive stock options |
61 | 91 | 136 | ||||||
| Diluted weighted average number of common shares outstanding |
16,498 | 16,408 | 16,377 | ||||||
| Diluted net income per common share |
$ | 1.34 | $ | 0.99 | $ | 0.78 | |||
| 17. | EMPLOYEE BENEFITS |
The Company has a defined contribution retirement plan covering substantially all of its eligible United States employees. Employer contributions under the retirement plan amounted to approximately $2,573, $2,452, and $2,205 during 2007, 2006, and 2005, respectively.
47
The Company provides supplemental pension benefits to its employees of foreign operations in addition to mandatory benefits included in local country payroll tax statutes. These supplemental pension benefits amounted to approximately $348, $425, and $437 during 2007, 2006, and 2005, respectively.
In June 2004, the Company’s Board of Directors approved the establishment of an Employee Stock Ownership Plan (“ESOP”) as the discretionary match portion of its 401(k) retirement plan. Prior to 2004, discretionary matches to the 401(k) plan were made in cash. The Company contributes to the ESOP for all eligible United States employees. Under the ESOP, which is 100% company funded, the Company allocates common stock to each participants account. The allocation is generally a percentage of a participant’s compensation as determined by the Board of Directors on an annual basis. The ESOP is accounted for under Statement of Position 93-6 Employer’s Accounting for Employee Stock Ownership Plans.
The Company made annual contributions to the ESOP of 69,311, 102,989, and 86,619 shares in January of 2008, 2007 and 2006, related to fiscal years 2007, 2006 and 2005, respectively. Contributions were based on annual compensation. All shares receive regular quarterly dividends payable to the ESOP to cover plan expenses.
The Company incurred pension expense under the ESOP of approximately $1,498, $1,407 and $1,180 during 2007, 2006 and 2005, respectively. These amounts are included in the total employer contributions to the retirement plan noted above.
As of January 1, 2007, there were no restrictions on the shares contributed to the ESOP. This allows participants to sell their shares to enable diversification within their individual 401(k) accounts. The Company does not have any repurchase obligations under the ESOP.
The Company awards deferred cash bonuses to key employees of its foreign operations. The deferred cash bonuses are similar to phantom stock units, in that such bonuses are tied to the value of the Company’s common stock. Awards are recognized over the deferral period as variable plan awards. The Company recognized approximately $539, $219 and $181 of compensation expense in 2007, 2006 and 2005, respectively, related to the awards.
48
| 18. | SEGMENT REPORTING |
The individual subsidiaries comprising the Company operate predominantly in a single industry as manufacturers and distributors of hydraulic components. The Company is multinational with operations in the United States, and subsidiaries in the United Kingdom, Germany, Korea, and France. Amounts for France, due to their immateriality, are included with the U.S. In computing operating profit for the foreign subsidiaries, no allocations of general corporate expenses have been made. Management bases its financial decisions by the geographical location of its operations.
Identifiable assets of the foreign subsidiaries are those assets related to the operation of those companies. United States assets consist of all other operating assets of the Company. Segment information is as follows:
| United States |
Korea | United Kingdom |
Germany | Elimination | Consolidated | ||||||||||||||
| 2007 |
|||||||||||||||||||
| Sales to unaffiliated customers |
$ | 99,516 | $ | 20,567 | $ | 23,127 | $ | 24,164 | $ | — | $ | 167,374 | |||||||
| Intercompany sales |
30,344 | — | 2,621 | 142 | (33,107 | ) | — | ||||||||||||
| Operating income |
22,408 | 2,103 | 3,205 | 5,955 | (36 | ) | 33,635 | ||||||||||||
| Identifiable assets |
74,026 | 9,067 | 17,079 | 12,710 | (2,102 | ) | 110,780 | ||||||||||||
| Depreciation and amortization |
4,488 | 178 | 1,119 | 556 | 6,341 | ||||||||||||||
| Capital expenditures |
9,339 | 284 | 2,843 | 125 | 12,591 | ||||||||||||||
| 2006 |
|||||||||||||||||||
| Sales to unaffiliated customers |
$ | 89,077 | $ | 16,368 | $ | 17,709 | $ | 19,128 | $ | — | $ | 142,282 | |||||||
| Intercompany sales |
25,809 | — | 2,990 | 106 | (28,905 | ) | — | ||||||||||||
| Operating income |
16,608 | 2,212 | 2,330 | 4,046 | (145 | ) | 25,051 | ||||||||||||
| Identifiable assets |
59,505 | 7,580 | 13,756 | 8,187 | (1,843 | ) | 87,185 | ||||||||||||
| Depreciation and amortization |
4,206 | 150 | 983 | 510 | 5,849 | ||||||||||||||
| Capital expenditures |
8,408 | 122 | 757 | 238 | 9,525 | ||||||||||||||
| 2005 |
|||||||||||||||||||
| Sales to unaffiliated customers |
$ | 73,998 | $ | 11,604 | $ | 16,054 | $ | 15,101 | $ | — | $ | 116,757 | |||||||
| Intercompany sales |
21,239 | — | 2,873 | 80 | (24,192 | ) | — | ||||||||||||
| Operating income |
13,443 | 1,520 | 1,260 | 3,145 | (188 | ) | 19,180 | ||||||||||||
| Identifiable assets |
50,019 | 4,958 | 12,403 | 8,777 | (2,596 | ) | 73,561 | ||||||||||||
| Depreciation and amortization |
3,944 | 149 | 1,025 | 473 | — | 5,591 | |||||||||||||
| Capital expenditures |
7,007 | 29 | 934 | 843 | — | 8,813 | |||||||||||||
Operating income is total sales and other operating income less operating expenses. Segment operating income does not include interest income/expense, foreign currency transaction gain/loss, and net miscellaneous income/expense.
Included in U.S. sales to unaffiliated customers were export sales of $29,283, $23,110, and $15,353, during 2007, 2006, and 2005, respectively. Export sales to Canada and Asia/Pacific totaling, $19,981, $15,853, and $12,681, during 2007, 2006, and 2005, respectively, make up the majority of these export sales. Additionally, export sales to Europe were $8,027, $5,346 and $2,027 during 2007, 2006, and 2005, respectively.
| 19. | COMMITMENTS AND CONTINGENCIES |
The Company is not a party to any legal proceedings other than routine litigation incidental to its business. In the opinion of management, the amount of ultimate liability with respect to these actions will not materially affect the results of operations, financial position or cash flows of the Company.
OPERATING LEASES — The Company leases a manufacturing facility in Lenexa, Kansas and production support facilities in Sarasota, Florida under operating leases having initial terms expiring between 2007 and 2008. The lease for the manufacturing facility in Kansas has a term of 5 years, expiring on November 14, 2008, and represents approximately 17,000 square feet of space. The leases for the production support facilities in Florida range from one to two years and represent approximately 10,000 square feet. Total rental expense for the years ended December 27, 2007, 2006 and 2005 was approximately $221, $226 and $182, respectively.
49
Future minimum lease payments on operating leases are as follows:
| 2008 |
151 | ||
| 2009 |
44 | ||
| Total minimum lease payments | $ | 195 | |
INSURANCE — On July 1, 2003, the Company changed its group health insurance plan that covers U.S. employees and their families from a fully-insured policy to a self-funded plan. The Company purchases re-insurance for both specific and aggregate stop losses on claims that exceed $100,000 on an individual basis and approximately $5.8 million on an aggregate basis. The Company records a liability for all unresolved claims at the anticipated cost to the Company at the end of the period based on the estimates provided by a third party administrator and insurance company, plus an estimate for amounts incurred but not recorded. The Company believes it has adequate reserves for all self-insurance claims.
| 20. | NEW ACCOUNTING PRONOUNCEMENTS |
In December 2007, the Financial Accounting Standards Board (“FASB”) issued SFAS No. 141 (revised 2007), Business Combinations (“SFAS 141R”). SFAS 141R establishes principles and requirements for an acquiring entity to recognize and measure in its financial statements the identifiable assets acquired, the liabilities assumed, any noncontrolling interest in the acquiree and the goodwill acquired. SFAS 141R expands on required disclosures to improve the statement users’ abilities to evaluate the nature and financial effects of business combinations. SFAS 141R is effective for fiscal years beginning after December 15, 2008. The Company is currently evaluating the potential impact, if any, of the adoption of SFAS 141R on its Consolidated Financial Statements.
In December 2007, the FASB issued SFAS No. 160, Noncontrolling Interests in Consolidated Financial Statements—an amendment of ARB No. 51 (“SFAS 160”). SFAS 160 requires that a noncontrolling interest in a subsidiary be reported within equity and the amount of consolidated net income attributable to the noncontrolling interest be identified in the consolidated financial statements. SFAS 160 calls for consistency in the manner of reporting changes in the parent’s ownership interest and requires fair value measurement of any noncontrolling equity investment retained in a deconsolidation. SFAS No. 160 also establishes disclosure requirements that clearly identify and distinguish between the interests of the parent and the interests of the noncontrolling owners. SFAS No. 160 is effective for fiscal years beginning after December 15, 2008. The Company is currently evaluating the potential impact, if any, of the adoption of SFAS 160 on its Consolidated Financial Statements.
In February 2007, FASB issued SFAS No. 159, The Fair Value Option for Financial Assets and Financial Liabilities (“SFAS 159”), which gives entities the option to measure eligible financial assets, and financial liabilities at fair value on an instrument by instrument basis, that are otherwise not permitted to be accounted for at fair value under other accounting standards. The election to use the fair value option is available when an entity first recognizes a financial asset or financial liability. Subsequent changes in fair value must be recorded in earnings. This statement is effective as of the beginning of a company’s first fiscal year after November 15, 2007. The adoption of this Statement is not expected to have a material effect on the Company’s Consolidated Financial Statements.
In September 2006, FASB issued SFAS No. 157, Fair Value Measurements (“SFAS 157”). SFAS 157 defines fair value, establishes a framework for measuring fair value in accordance with generally accepted accounting principles, and expands disclosures about fair value measurements. SFAS 157 is effective for fiscal years beginning after November 15, 2007. The adoption of this Statement is not expected to have a material effect on the Company’s Consolidated Financial Statements.
50
| ITEM 9. | CHANGES IN AND DISAGREEMENTS WITH ACCOUNTANTS ON ACCOUNTING AND FINANCIAL DISCLOSURE |
None.
| ITEM 9A. | CONTROLS AND PROCEDURES |
Controls and Procedures
Our Chief Executive Officer and our Chief Financial Officer, after evaluating the effectiveness of the Company’s “disclosure controls and procedures” (as defined in Rules 13a-15(e) and 15d-15(e) under the Securities Exchange Act of 1934, as amended) as of the end of the period covered by this report, have concluded that our disclosure controls and procedures are effective and are designed to ensure that the information we are required to disclose is recorded, processed, summarized and reported within the necessary time periods. Our disclosure controls and procedures include, without limitation, controls and procedures designed to ensure that information required to be disclosed by us in reports that we file or submit pursuant to the Securities Exchange Act of 1934, as amended, are accumulated and communicated to our management, including our Chief Executive Officer and Chief Financial Officer, as appropriate to allow timely decisions regarding required disclosure.
Internal Control Over Financial Reporting
Management is responsible for establishing and maintaining adequate internal control over financial reporting.
There were no changes in the Company’s internal control over financial reporting during the quarter ended December 29, 2007, that materially affected, or are reasonably likely to materially affect, the Company’s internal control over financial reporting.
Management’s Report on Internal Control over Financial Reporting
Management of the Company is responsible for establishing and maintaining adequate internal control over financial reporting, as such term is defined in Exchange Act Rule 13a-15(f). The Company’s internal control over financial reporting is a process designed to provide reasonable assurance regarding the reliability of financial reporting and the preparation of financial statements for external purposes in accordance with generally accepted accounting principles. Internal control over financial reporting includes those policies and procedures that:
| • | pertain to the maintenance of records that, in reasonable detail, accurately and fairly reflect the transactions and dispositions of the assets of the Company; |
| • | provide reasonable assurance that transactions are recorded, as necessary, to permit preparation of financial statements in accordance with generally accepted accounting principles, and that receipts and expenditures of the Company are being made only in accordance with authorizations of management and directors of the Company; and |
| • | provide reasonable assurance regarding prevention or timely detection of unauthorized acquisition, use or disposition of the Company’s assets that could have a material effect on the financial statements. |
Because of its inherent limitations, internal control over financial reporting may not prevent or detect misstatements. Management conducted an evaluation of the effectiveness of the Company’s internal control over financial reporting based on the criteria set forth in Internal Control - Integrated Framework issued by the Committee of Sponsoring Organizations of the Treadway Commission. Based on this evaluation under the Internal Control - Integrated Framework, management concluded that the internal control over financial reporting was effective as of December 29, 2007.
51
The effectiveness of the Company’s internal control over financial reporting as of December 29, 2007 has been audited by Kirkland, Russ, Murphy and Tapp, P.A., an independent registered certified public accounting firm, as stated in their report.
| ITEM 9B. | OTHER INFORAMTION |
None.
52
PART III.
| ITEM 10. | DIRECTORS, EXECUTIVE OFFICERS OF THE REGISTRANT AND CORPORATE GOVERNANCE MATTERS |
Executive Officers
The information required by this item with respect to our executive officers is set forth in our 2008 Proxy Statement under the caption “Governance of the Company” and is incorporated herein by reference.
Directors
The information required by this item with respect to our board of directors and committees thereof is set forth in our 2008 Proxy Statement under the caption “Governance of the Company” and is incorporated herein by reference.
Section 16(a) Beneficial Ownership Reporting Compliance
The information required by this item with respect to Section 16(a) beneficial ownership reporting compliance is set forth in our 2008 Proxy Statement under the caption “Compliance with Section 16(a) of the Securities Exchange Act of 1934” and is incorporated herein by reference.
Code of Business Conduct and Ethics
The information required by this item with respect to our Code of Business Conduct and Ethics is set forth in our 2008 Proxy Statement under the caption “Governance of the Company” and is incorporated herein by reference.
| ITEM 11. | EXECUTIVE COMPENSATION |
The information required by this item is set forth under the caption ‘Executive Compensation” in our 2008 Proxy Statement and is incorporated herein by reference.
| ITEM 12. | SECURITY OWNERSHIP OF CERTAIN BENEFICIAL OWNERS AND MANAGEMENT AND RELATED STOCKHOLDER MATTERS |
The information required by this item with respect to equity compensation plans is set forth under the caption “Equity Compensation Plan Information” in our 2008 Proxy Statement and with respect to security ownership of certain beneficial owners, directors and executive officers is set forth under the caption “Security Ownership of Certain Beneficial Owners and Management” in our 2008 Proxy Statement and is incorporated herein by reference.
| ITEM 13. | CERTAIN RELATIONSHIPS, RELATED TRANSACTIONS AND DIRECTOR INDEPENDENCE |
The information required by this item is set forth under the captions “Compensation Committee Interlocks and Insider Participation,” “Certain Relationships and Related Transactions” and “Independence and Committees of the Board of Directors” in our 2008 Proxy Statement and is incorporated herein by reference.
| ITEM 14. | PRINCPAL ACCOUNTING FEES AND SERVICES |
The information required by this item is set forth under the caption “Independent Registered Public Accounting Firm” in our 2008 Proxy Statement and is incorporated herein by reference.
53
PART IV
| ITEM 15. | EXHIBITS AND FINANCIAL STATEMENT SCHEDULES |
| 1. | The following financial statements are included in Part II, Item 8: | |||
| Report of Independent Registered Certified Public Accounting Firm | 29 | |||
| Report of Independent Registered Public Accounting Firm | 30 | |||
| Consolidated Balance Sheets as of December 29, 2007, and December 30, 2006 | 31 | |||
| Consolidated Statements of Operations for the years ended December 29, 2007, December 30, 2006, and December 31, 2005 | 32 | |||
| Consolidated Statements of Shareholders’ Equity for the years ended December 29, 2007, December 30, 2006, and December 31, 2005 | 33 | |||
| Consolidated Statements of Cash Flows for the years ended December 29, 2007, December 30, 2006, and December 31, 2005 | 34 | |||
| Notes to Consolidated Financial Statements | 35 | |||
| All other schedules are omitted as the required information is inapplicable or the information is presented in the consolidated financial statements and notes thereto in Item 8 above. | ||||
| 2. | Exhibits: | |||
| Exhibit |
Exhibit Description | |
| 3.1 | Amended and Restated Articles of Incorporation of the Company (previously filed as Exhibit 3.1 in the Pre-Effective Amendment No. 4 to the Company’s Registration Statement on Form S-1 filed on December 19, 1996 (File No. 333-14183) and incorporated herein by reference). | |
| 3.2 | Amended and Restated Bylaws of the Company (previously filed as Exhibit 3.2 in the Company’s Quarterly report on Form 10-Q for the quarter ended October 2, 1999 and incorporated herein by reference). | |
| 3.2.1 | Certificate of Amendment to Amended and Restated Bylaws of the Company (previously filed as Exhibit 3.2.1 in the Company’s Quarterly report on Form 10-Q for the quarter ended March 27, 2004 and incorporated herein by reference). | |
| 3.2.2 | Certificate of Amendment of Bylaws of the Company (previously filed as Exhibit 3.1 in the Company’s Quarterly Report on Form 10-Q for the quarter ended March 31,2007 and incorporated herein by reference). | |
| 10.1+ | Form of Indemnification Agreement (previously filed as Exhibit 10.4 in the Pre-Effective Amendment No. 4 to the Company’s Registration Statement on Form S-1 filed on December 19, 1996 (File No. 333-14183) and incorporated herein by reference). | |
| 10.2 | Form of Distributor Agreement (Domestic) (previously filed as Exhibit 10.1 in the Company’s Registration Statement on Form S-1 filed on October 15, 1996 (File No. 333-14183) and incorporated herein by reference). | |
54
| 10.3 | Form of Distributor Agreement (International) (previously filed as Exhibit 10.2 in the Company’s Registration Statement on Form S-1 filed on October 15, 1996 (File No. 333-14183) and incorporated herein by reference). | |
| 10.4 | Mortgage, dated April 11, 1996, between Sun Hydraulik GmbH and Dresdner Bank (previously filed as Exhibit 4.19 in the Company’s Registration Statement on Form S-1 filed on October 15, 1996 (File No. 333-14183) and incorporated herein by reference). | |
| 10.5 | Credit and Security Agreement dated August 11, 2005, between the Company, as Borrower, and Fifth Third Bank, as Lender (previously filed as Exhibit 4.1 to the Company’s Quarterly Report on Form 10-Q for the quarter ended October 1, 2005 and incorporated herein by reference). | |
| 10.6 | Renewal and Future Advance Revolving Line of Credit Promissory Note dated August 11, 2005, between the Company, as Borrower, and Fifth Third Bank, as Lender (previously filed as Exhibit 4.2 to the Company’s Quarterly Report on Form 10-Q for the quarter ended October 1, 2005 and incorporated herein by reference). | |
| 10.7 | Renewed, Amended and Restated Mortgage and Security Agreement dated August 11, 2005, between the Company, as Mortgagor, and Fifth Third Bank, as Mortgagee (previously filed as Exhibit 4.3 to the Company’s Quarterly Report on Form 10-Q for the quarter ended October 1, 2005 and incorporated herein by reference). | |
| 10.8 | Credit and Security Agreement dated July 23, 2003, between the Company, Sun Hydraulik Holdings Limited and Sun Hydraulics Limited as Borrower, and SouthTrust Bank as Lender (previously filed as Exhibit 10.10 to the Company’s Quarterly Report on Form 10-Q for the quarter ended June 28, 2003 and incorporated herein by reference). | |
| 10.9 | Master Loan Documents Modification Agreement dated as of November 18, 2003, between the Company, Sun Hydraulik Holdings Limited and Sun Hydraulics Limited as Borrower, and SouthTrust Bank as Lender (previously filed as Exhibit 10.11 to the Company’s Annual Report on Form 10-K for the year ended December 31, 2005 and incorporated herein by reference). | |
| 10.10+ | 1996 Sun Hydraulics Corporation Stock Option Plan (previously filed as Exhibit 10.3 in the Pre-Effective Amendment No. 4 to the Company’s Registration Statement on Form S-1 filed on December 19, 1996 (File No. 333-14183) and incorporated herein by reference). | |
| 10.11+ | Amendment No. 1 to 1996 Stock Option Plan (previously filed as Exhibit 10.4 to the Company’s Quarterly Report on Form 10-Q for the quarter ended June 30, 1997 and incorporated herein by reference). | |
| 10.12+ | Forms of agreement for grants under the Sun Hydraulics Corporation 1996 Stock Option Plan (previously filed as Exhibit 10.12+ to the Company’s Quarterly Report on Form 10-Q for the quarter ended September 25, 2004 and incorporated herein by reference). | |
| 10.13+ | Sun Hydraulics Corporation 2006 Stock Option Plan (previously filed as Exhibit 99.2 to the Company’s Form 8-K filed on September 14, 2006 and incorporated herein by reference). | |
| 10.14+ | Sun Hydraulics Corporation Employee Stock Award Program (previously filed as Exhibit 4 to the Company’s registration statement on Form S-8 filed on July 20, 1999, and incorporated herein by reference). | |
55
| 10.15+ | 2001 Sun Hydraulics Corporation Restricted Stock Plan (previously filed as Exhibit 4 to the Company’s registration statement on Form S-8 filed on June 12, 2001 (file No. 333-62816), and incorporated herein by reference). | |
| 10.16+ | Sun Hydraulics Corporation Employee Stock Purchase Plan (previously filed as Exhibit 4 to the Company’s registration statement on Form S-8 filed on July 27, 2001 (file No. 333-66008), and incorporated herein by reference). | |
| 10.17+ | Sun Hydraulics Corporation 2004 Nonemployee Director Equity and Deferred Compensation Plan (As Amended and Restated Effective January 1, 2005) (previously filed as Exhibit 10.1+ to the Company’s Quarterly Report on Form 10-Q for the quarter ended July 2, 2005 and incorporated herein by reference). | |
| 10.18+ | Sun Hydraulics Corporation Amended and Restated 2004 Nonemployee Director Equity and Deferred Compensation Plan (previously filed as Exhibit 99.1 to the Company’s Form 8-K filed on September 14, 2006 and incorporated herein by reference). | |
| 10.19+ | Form of Performance Share Agreement (previously filed as Exhibit 99.1 to the Company’s Form 8-K filed on December 16, 2004 and incorporated herein by reference). | |
| 10.20+ | The Sun Hydraulics Corporation 401(k) and ESOP Retirement Plan (previously filed as Exhibit 99.1 to the Company’s Form 8-K filed on January 14, 2005 and incorporated herein by reference). | |
| 10.21+ | Sun Hydraulics Corporation Amended and Restated 2004 Nonemployee Director Equity and Deferred Compensation Plan (previously filed as Exhibit 10.1 to the Company’s Form 10-Q for the quarter ended September 29,2007 and incorporated herein by reference). | |
| 10.22 | Securities Purchase Agreement between Sun Hydraulics Corporation and High Country Tek, Inc., dated November 30,2007 (previously filed as Exhibit 99.1 in the Company’s Form 8-K filed on November 30,2007 and incorporated herein by reference). | |
| 14 | Code of Ethics (previously filed as Exhibit 14 in the Company’s Annual report on Form 10-K for the year ended December 31, 2005 and incorporated herein by reference). | |
| 21 | Subsidiaries of the Registrant (previously filed as Exhibit 21 in the Company’s Annual report on Form 10-K for the year ended December 31, 2005 and incorporated herein by reference). | |
| 23.1 | Grant Thornton LLP Consent of Independent Registered Public Accounting Firm | |
| 23.2 | Kirkland, Russ, Murphy and Tapp, P.A. Consent of Independent Registered Certified Public Accounting Firm. | |
| 31.1 | CEO Certification pursuant to Section 302 of the Sarbanes-Oxley Act of 2002. | |
| 31.2 | CFO Certification pursuant to Section 302 of the Sarbanes-Oxley Act of 2002. | |
| 32.1 | CEO Certification pursuant to 18 U.S.C. § 1350. | |
| 32.2 | CFO Certification pursuant to 18 U.S.C. § 1350. | |
| + | Executive management contract or compensatory plan or arrangement. |
56
SIGNATURES
Pursuant to the requirements of Section 13 or 15(d) of the Securities Exchange Act of 1934, the Registrant has duly caused this Report to be signed on its behalf by the undersigned, thereunto duly authorized, in the City of Sarasota, State of Florida on March 12, 2008.
| SUN HYDRAULICS CORPORATION | ||
| By: | /s/ Allen J. Carlson | |
| Allen J. Carlson, President and Chief Executive Officer | ||
Pursuant to requirements of the Securities Exchange Act of 1934, this Report has been signed by the following persons on behalf of the Registrant and in the capacities indicated as of March 12, 2008.
| Signature |
Title | |||
| /s/ Allen J. Carlson |
||||
| Allen J. Carlson | President, Chief Executive Officer and Director | |||
| /s/ Tricia L. Fulton |
Chief Financial Officer (Principal Financial and Accounting Officer) | |||
| Tricia L. Fulton | ||||
| /s/ Marc Bertoneche |
||||
| Marc Bertoneche | Director | |||
| /s/ John S. Kahler |
||||
| John S. Kahler | Director | |||
| /s/ Christine L. Koski |
||||
| Christine L. Koski | Director | |||
| /s/ Robert E. Koski |
||||
| Robert E. Koski | Director | |||
| /s/ Philippe Lemaitre |
||||
| Philippe Lemaitre | Director | |||
| /s/ Ferdinand E. Megerlin |
||||
| Ferdinand E. Megerlin | Director, Chairman of the Board of Directors | |||
| /s/ Hirokatsu Sakamoto |
||||
| Hirokatsu Sakamoto | Director | |||
| /s/ David N. Wormley |
||||
| David N. Wormley | Director | |||
57