UNITED STATES
SECURITIES AND EXCHANGE COMMISSION
WASHINGTON, D.C. 20549
FORM 10-K
ANNUAL REPORT PURSUANT TO SECTION 13 OR 15(d) OF THE
SECURITIES EXCHANGE ACT OF 1934
| For the fiscal year ended December 31, 2011 | Commission file number 0-21835 |
SUN HYDRAULICS CORPORATION
(Exact Name of Registration as Specified in its Charter)
| Florida | 59-2754337 | |
| (State or Other Jurisdiction of Incorporation or Organization) |
(I.R.S. Employer Identification No.) |
| 1500 West University Parkway Sarasota, Florida |
34243 | |
| (Address of Principal Executive Offices) | (Zip Code) |
941/362-1200
(Registrant’s Telephone Number, Including Area Code)
Securities registered pursuant to Section 12(b) of the Act
| Title of Each Class |
Name of each exchange on which registered | |
| Common Stock $.001 Par Value | NASDAQ Stock Market, LLC |
Securities registered pursuant to Section 12(g) of the Act:
| Title of Each Class |
Name of each exchange on which registered | |
| Common Stock $.001 Par Value | NASDAQ Stock Market, LLC |
Indicate by check mark if the registrant is a well-known seasoned issuer, as defined in Rule 405 of the Securities Act. Yes ¨ No x
Indicate by check mark if the registrant is not required to file reports pursuant to Section 13 or Section 15(d) of the Exchange Act. Yes ¨ No x
Indicate by check mark whether the Registrant (1) has filed all reports required to be filed by Section 13 or 15(d) of the Securities Exchange Act of 1934 during the preceding 12 months (or for such shorter period that the Registrant was required to file such reports), and (2) has been subject to such filing requirements for the past 90 days. Yes x No ¨
Indicate by check mark whether the registrant has submitted electronically and posted on its corporate Web site, if any, every Interactive Data File required to be submitted and posted pursuant to Rule 405 of Regulation S-T (§232.405 of this chapter) during the preceding 12 months (or for such shorter period that the registrant was required to submit and post such files). Yes x No ¨
Indicate by check mark if disclosure of delinquent filers pursuant to Item 405 of Regulation S-K is not contained herein, and will not be contained, to the best of Registrant’s knowledge, in definitive proxy or information statements incorporated by reference in Part III of this Form 10-K or any amendment to this Form 10-K. ¨
Indicate by check mark whether the registrant is a large accelerated filer, an accelerated filer, or a non-accelerated filer. See definition of “accelerated filer and large accelerated filer” in Rule 12b-2 of the Exchange Act. (Check one):
| Large accelerated filer | ¨ | Accelerated filer | x | |||
| Non-accelerated filer | ¨ | Smaller Reporting Company | ¨ | |||
Indicate by check mark whether the registrant is a shell company (as defined in Rule 12b-2 of the Exchange Act). Yes ¨ No x
The aggregate market value of the shares of voting common stock held by non-affiliates of the Registrant, computed by reference to the closing sales price of such shares on the Nasdaq Stock Market, LLC, as of the last business day of the Registrant’s most recently completed second fiscal quarter was $638,204,908.
As of February 24, 2012, there were 25,767,160 shares of common stock outstanding.
PART I
ITEM 1. BUSINESS
Overview
Sun Hydraulics Corporation (“Sun,” the “Company” or “We”) was founded in 1970, in Sarasota, FL, USA, and for the past 41 years has provided global capitals goods industries with hydraulics components and systems used to transmit power and control force, speed and motion. Sun’s products typically add a fine degree of precision and safety to the machinery and equipment in which they are used.
On a component level, Sun designs and manufactures screw-in hydraulic cartridge valves, manifolds, and integrated fluid power packages and subsystems. The Company’s products provide an important control function within a hydraulic system, to control rates and direction of fluid flow and to regulate and control pressures.
Sun’s screw-in hydraulic cartridge valves use a fundamentally different design platform compared to most other competitive product offerings, which are often referred to as industry common products. The Company’s cartridge valves, from the first models in the early 1970s, were designed to be able to operate reliably at higher pressures, making them equally suitable for both industrial and mobile applications. Until recently, most other companies’ screw-in cartridge valves were only suitable for use in mobile applications. Sun’s brand has grown and become identified as a product able to withstand the rigors of industrial use, where operating cycles and pressures are higher and more frequent.
To complement the high pressure, high duty cycle nature of its cartridge valves, Sun offers the broadest array of standard manifolds of any cartridge valve manufacturer. These products, available in both aluminum and ductile iron, allow the Company’s cartridge valves to be easily and conveniently installed in machinery and equipment. Sun’s standard manifolds feature common interfaces, ports and industry standard patterns to make them applicable for use in any country.
All of Sun’s standard cartridge valves and manifolds are offered in multiple versions and size ranges. The product array features five different capacities (this represents flow rates or could conveniently be referenced as horsepower), with capacity doubling with each successive size. Each version offers a subtle variation of functionality. This allows machine designers to choose a product that is optimal to the operating conditions of the equipment they are designing. Sun is unique in the industry in approaching product development in this matrix manner, which yields a product line of extreme breadth and depth. Sun’s broad scope of product offering, coupled with the high performance characteristics of its cartridge valves, makes Sun a leader in its industry.
To fully leverage its cartridge product family, the Company routinely competes in the custom manifold and integrated package market. This activity entails designing custom manifolds which incorporate multiple standard cartridge valves to create a unique and machine specific solution for a particular customer. Because of the unique nature of Sun’s cartridge valve designs, manifolds may be designed and machined to make them significantly smaller, sometimes greater than 50% smaller, when compared to manifolds that use only industry common cartridge valves. The same design characteristics that allow manifolds to be smaller also allow them to operate more efficiently by incorporating angular drillings in the design. Integrated packages allow customers to order a single part number, reduce assembly and labor time on the factory floor, and easily locate a complete hydraulic control system anywhere on a machine.
In recent years, the Company has aggressively expanded its offering of electrically-actuated cartridge valves. Despite being a late entrant in the industry with these types of products, Sun’s design approach has allowed the Company to quickly offer a full range of electrically-actuated cartridge valves, helping to increase the competiveness of the integrated package offerings. Because hydraulics systems are increasingly taking signals from on-board electronic control systems, it is necessary for hydraulic products to be capable of digital communication.
2
To further augment its capabilities in the electronic area, the Company recently completed the acquisition of High Country Tek, Inc. (“HCT”), which designs and manufactures a range of standard and customizable electronic control modules used to interpret electronic signals. The addition of HCT’s capabilities with Sun’s legacy products and capabilities expands the scope of unique product solutions the Company can offer its customers.
Sun’s products are sold globally through a combination of wholly-owned companies, representative sales offices and independent and authorized distributors. Sun has operations in the United States, England, Germany, France, South Korea, China and India. Activities at these locations range from technical support, to inventory, to distributor management, to custom manifold design and manufacturing. Sun’s global distribution network includes representation in almost all industrialized markets. Distributors are the local experts in Sun’s products. They typically hold local inventory and transact all business with customers. This arrangement helps to keep selling, general and administrative costs to a minimum, with above industry average inventory turns and free cash flows.
In 2011, 47% of consolidated sales went to customers in the Americas, 32% to customers in Europe, the Middle East and Africa, and 21% to customers in the Asia/Pacific Region. In 2011, sales to any single customer or distributor did not exceed 7% of total net sales.
The Company has been profitable every year since 1972 and has paid a dividend every quarter since going public in January 1997. The Company’s executive offices are located at 1500 West University Parkway, Sarasota, Florida 34243, and its telephone number is (941) 362-1200. The Company’s website is www.sunhydraulics.com.
Industry Background
Sun is part of the fluid power industry, in which either air (pneumatics) or oil (hydraulics) is used to transmit power and provide motion control for many types of machinery, equipment and vehicles. The modern fluid power industry developed around World War II as both hydraulics and pneumatics were widely adopted as effective means of motion control. Hydraulics, because of its mechanical advantage, is typically used when significant work needs to be accomplished or heavy loads need to be moved. Hydraulics systems also provide precise positioning and movement of lighter loads. Examples where hydraulics are routinely used include steering and braking activities in construction, agricultural and marine equipment; raising work platforms and ladders in construction and fire and rescue equipment; holding and clamping parts or moving machine elements in machine tools; and measuring in laboratory test equipment; controlling the direction and pitch of blades in windmills - the list of uses of hydraulics is wide and varied and encompasses almost all industries.
Valves are major components of a hydraulic system, along with pumps and actuators. These devices are complemented by a wide range of ancillary and supporting products that includes, but is not limited to, hoses, fittings, accumulators, regulators, heat exchangers, sensors and lubricants. Valves provide the function of directing the flow of fluid, setting the rate of its flow and regulating pressures in the system.
Screw-in hydraulic cartridge valves, the type of product the Company manufactures, were initially developed in the late 1950s and early 1960s as an alternative to the then existing technology, which we refer to as conventional valves. Conventional valves were typically single purpose devices made with cumbersome iron casting that were limited in how they could be installed in machinery and equipment. In times of economic expansion, these types of products could become difficult to obtain due to the inability to easily source castings. Screw-in cartridge valves are made from easily obtainable commercial steels, which make supply more consistent. More importantly, multiple cartridge valves can be combined together in a single block of machined aluminum, ductile iron or steel, to create a hydraulic integrated circuit, which in almost all respects is analogous to an electronic integrated circuit. The hydraulic integrated circuit provides significant benefits to the machine designer, including ease of order and inventory control, ease of location in machinery and equipment, reduced labor and assembly time, proprietary control systems and a way to differentiate machinery and equipment.
3
The hydraulics industry is comprised of companies that make all the types of components that are needed to create a hydraulic system, companies that make specific components of a system, such as Sun, and companies that make specialty components. The large companies that make all components are multi-national corporations. Specific component manufacturers increasingly have the ability to conduct business globally.
The hydraulics industry is increasingly being influenced by the electronic industry, as more machinery and equipment is equipped with on board electronic control systems. This affects purchasing decisions hydraulic components, design criteria, machine and vehicle performance, safety and many other attributes and characteristics. The line between electronics and hydraulics is blurring and the two technologies must be able to digitally communicate. The Company expects this trend will continue in the future.
Strategy
Sun will continue to design, manufacture, market and support, on a worldwide basis, differentiated high-performance and high-quality products and systems. The Company believes this focus supports its business objectives of generating sustainable revenue growth that will consistently yield above-average returns on capital while achieving a high level of customer satisfaction. Key elements of the Company’s strategy include the following:
Deliver Value Through High-Quality, High-Performance Products. The Company’s products are designed with operating and performance characteristics that exceed those of many functionally similar products. The Company’s products provide high value because they generally operate more reliably and at higher flow rates and pressures than competitive offerings of the same size.
Achieve a High Level of Customer Satisfaction. Sun schedules orders to the customer’s request date. The Company believes that its long-term success is dependent upon its reputation in the marketplace, which in turn is a result of its ability to service its customers. The Company tests 100% of its screw-in cartridge valves to ensure the highest level of performance on a consistent basis. Through our products and services, Sun will seek to create value for its customers by helping them differentiate their own product and service offerings.
Offer a Wide Variety of Standard Products. Sun offers the most comprehensive range of screw-in cartridge valves and manifolds in the world. The Company’s products contain a high degree of common content to minimize work in process and maximize manufacturing efficiency. Products are designed for use by a broad base of industries to minimize the risk of dependence on any single market segment or customer.
Expand the Product Line. New products are designed to complement existing products and this has a synergistic effect. Where possible, new products use existing parts and generally fit into existing cavities. The Company will continue to develop new non-electrical and electrically actuated cartridge valves, including solenoid and proportional valves. The Company believes its electrically-actuated cartridge valves help to increase sales of the Company’s other cartridge valves and allow the Company to compete more effectively for integrated package business.
Expand Electronics Capabilities. Through acquisition and internal development, the Company has continued to expand its electronics capabilities. This is important because many machines and vehicles have central electronic control systems which direct all system activities, including those of the hydraulics system. The Company will continue to evolve its electronic controls capabilities to support creating superior solutions for its customers.
Capitalize on Integrated Package Opportunities. Sun designs and manufactures integrated packages which incorporate the Company’s screw-in cartridge valves. To support this effort, the Company designs and manufactures manifolds at its operations in Sarasota, Florida, and Kansas City, Kansas, USA, Coventry, England, Erkelenz, Germany, and Incheon, Korea. Some of the Company’s distributors also design and manufacture integrated packages which contain the Company’s screw-in cartridge valves. Sun encourages competitive manifold manufacturers to utilize the Company’s screw-in cartridge valves in their integrated package designs. The Company believes that customers in the future will increasingly require integrated packages more than isolated components.
4
Expand Global Presence. Sun intends to continue to expand its global presence in the areas of distribution and international operations. The Company has strong distributor representation in most developed and developing markets, including North and South America, Western Europe, Asia, Australia, and South Africa. The Company will continue to expand its presence in key areas including, but not limited to, Eastern Europe, Russia, China and India. A strong local presence helps the Company compete for integrated package business, where proximity to its customers is beneficial.
Maintain a Horizontal Organization with Entrepreneurial Spirit. Sun believes that maintaining its horizontal management structure is critical to retaining key personnel and an important factor in attracting top talent. The Company believes this culture encourages communication, creativity, entrepreneurial spirit and individual responsibility among employees, and has a large impact on operating results.
Leverage Manufacturing Capability and Know-how as Competitive Advantages. Sun believes its process expertise is a competitive advantage. The Company’s strong process capability is critical in achieving the high performance characteristics of its screw-in cartridge valves and integrated packages. The Company’s in-house heat-treatment capability, somewhat unique in the industry, is critical to the durability and differentiation of the Company’s cartridge valve products.
Sell Through Distributors. Due to the variety of potential customers and the Company’s desire to avoid overhead costs, North America sales are made primarily through independent distributors. Sun’s international locations sell both to direct customers and through independent distributors. Many of the Company’s distributors sell products manufactured by other companies and act as system integrators by providing complete hydraulic systems to customers.
Develop Closer Relations with Key Customers. The Company maintains close relationships with some OEMs and end users of its products. These relationships help the Company understand and predict future marketplace needs and provide a venue to test and refine new product offerings. The Company recognizes it may sometimes be required to enter into direct transactional relationships to gain business with certain large OEMs. The Company intends to be selective in developing these relationships to avoid unnecessary bureaucracy and cost.
Form Strategic Relationships/Acquisitions. When management deems it to be of strategic benefit, Sun may enter into relationships with other hydraulics manufacturers including, but not limited to, marketing, brand labeling and other non-exclusive or exclusive agreements. In the future the Company expects to expand its internally developed products and capabilities through investments in outside firms. These investments could be full acquisitions, joint ventures, partial ownership investments or other agreements.
Capture value for our stakeholders. Through our culture and organizational structure, we prudently manage our resources and strive to balance operational efficiencies with developing innovative products and services. This allows us to provide superior value to our customers by delivering high quality, reliable products to the customer’s schedule which, in turn, has resulted in sustained profits for the Company. In addition to quarterly cash dividends, Sun has developed a shared distribution which allows stakeholders, including shareholders and employees, to participate in the profits Sun earns.
Products
Screw-in Hydraulic Cartridge Valves
Sun’s screw-in hydraulic cartridge valves are offered in five size ranges and include both electrically actuated and non-electrically actuated products. The floating construction pioneered by the Company results in a self alignment characteristic that provides performance and reliability advantages compared to most competitors’ product offerings. This floating construction differentiates the Company’s products from those of most of its competitors, who design and manufacture rigid screw-in cartridge valves that fit a common cavity. Some competitors manufacture certain products that fit the Company’s cavity.
5
Standard Manifolds
A manifold is a solid block of metal, usually aluminum or ductile iron, which is machined to create threaded cavities and channels into which screw-in cartridge valves can be installed and through which the hydraulic fluid flows.
The variety of standard manifolds offered by Sun is unmatched by any screw-in cartridge valve or manifold competitor. These products allow customers to easily integrate the Company’s screw-in cartridge valves into their machinery and equipment. Once designed, standard manifolds require minimal, if any, maintenance engineering over the life of the product and can be manufactured at each of the Company’s manufacturing operations.
Integrated Packages (using custom designed manifolds)
An integrated package consists of multiple cartridge valves assembled into a custom designed manifold for a specific customer to provide the specific operating characteristics of a customer’s circuit.
The advantages of Sun screw-in cartridge valves translate to integrated packages designed by the Company and result in products that are smaller in size with enhanced operating performance. Due to the self-alignment characteristic, the Company’s integrated packages do not routinely require testing once assembled, something often required when using competitive cartridge valves. Additionally, the Company has internally-developed proprietary expert system software that it uses to manufacture custom manifolds efficiently in low volumes. Integrated packages provide many benefits to end users and equipment manufacturers, including reduced assembly time, order simplification, reduced leakage points, aesthetics, potentially fewer hose and fitting connections, and more control functions in a single location.
Electronic Controllers
Sun completed the acquisition of High Country Tek (“HCT”) in 2011 (see Note 9 to Financial Statements). HCT designs and manufactures electronic controllers, which manage the function of electrically actuated valves. HCT’s products range from simple one valve, manually adjusted controllers to fully integrated hydraulic control systems managing multiple hydraulic valves as well as other input and output products such as joysticks and displays. All controllers are potted and therefore impervious to outside influence making them ideal for mobile, industrial and marine applications.
HCT’s products in combination with the Sun product line enable integration at the next level by optimizing manifold valves and electronic controllers into solutions for complete systems or as building blocks for our distributors and direct customers.
Engineering
Sun’s engineers play an important role in all aspects of the business, including design, manufacturing, sales, marketing and technical support. Engineers work within a disciplined set of design parameters that encourages the repeated incorporation of existing parts into new products. Engineers work closely with manufacturing personnel to define the processes required to manufacture products reliably and consistently.
Manufacturing
The Company utilizes a process intensive manufacturing operation that makes extensive use of automated handling and assembly technology (including robotics) where possible to perform repetitive tasks, thus promoting manufacturing efficiencies and workplace safety. The Company is somewhat vertically integrated and has the capability to manufacture many of the parts that go into its products.
At its two Sarasota, Florida, manufacturing plants, the Company has extensive testing facilities that allow it to test fully all cartridge valve products. A metallurgist and complete metallurgical laboratory support the Company’s design engineers and in-house heat treatment.
6
The Company holds minimal finished goods inventory, typically at its overseas facilities, and relies on its distributors to purchase and maintain sufficient inventory to meet customers’ demands. Most raw materials, including aluminum and steel, are delivered on a just-in-time basis. These and other raw materials are commercially available from multiple sources.
The Company controls most critical finishing processes in-house but relies on a small network of outside manufacturers to machine cartridge parts to varying degrees of completeness. Many high-volume machining operations are performed exclusively at outside suppliers. The Company is selective in establishing its supplier base and attempts to develop and maintain long-term relationships with suppliers.
The Company continually reviews all of its suppliers to improve the quality of incoming parts and to assess opportunities for better control of both price and quality. The Company’s quality systems at the U.S. facilities are in compliance with ISO 9001:2008 for design and manufacture of steel cartridge valves and aluminum and ferrous manifolds for hydraulic systems. Those in the U.K. are certified to ISO 9001:2008 for the design and manufacture of aluminum and ferrous manifold bodies, hydraulic control valves and cartridge valves. Quality systems in Germany are certified to ISO 9001:2008 for the design, distribution and manufacturing of hydraulic components for mobile and industrial applications. Finally, quality systems in Korea are certified to ISO 9001:2008 and 14001:2004 for the design, development, production and servicing of hydraulic valves.
Sales and Marketing
Sun products are sold globally, primarily through independent fluid power distributors. Technical support is provided by each of the Company’s operations (Florida, Kansas, England, Germany, France, Korea, India and China).
The Company currently has 86 distributors, 64 of which are located outside the United States and a majority of which have strong technical backgrounds or capabilities, which enable them to develop practical, efficient, and cost-effective fluid power systems for their customers. In 2011, sales to the Company’s largest distributor represented less than 7% of net sales.
In addition to distributors, the Company sells directly to other companies within the hydraulics industry, including competitors, who incorporate the Company’s products into their hydraulic products or systems. The Company believes that making it easy for other manufacturers to buy its products offers these manufacturers a better alternative to developing similar products themselves.
To a limited degree, the Company sells product directly to OEMs. Although the Company does not have any employee whose primary responsibility is direct sales, it may consider this in the future. The Company recognizes that, to gain access to certain large OEM accounts, it may have to deal directly with customers in the areas of sales and support.
The Company provides end users with technical information through its website and catalogues, including all information necessary to specify and obtain the Company’s products. The Company believes this approach helps stimulate demand for the Company’s products. The Company’s website is-comprehensive and easy to use with product information available 24 hours a day, seven days a week around the world, in multiple languages.
Customers
Customers are broadly classified as mobile or industrial customers.
Mobile applications involve equipment that generally is not fixed in place and is often operated in an uncontrolled environment, such as construction, agricultural, mining, and fire and rescue and other utility equipment. Mobile customers historically account for approximately two-thirds of the Company’s net sales.
Industrial applications involve equipment that generally is fixed in place in a controlled environment. Examples include automation machinery, presses, plastics machinery such as injection molding equipment, and machine tools. Industrial applications historically account for approximately one third of the Company’s net sales.
7
In recent years, new applications have emerged that blend requirements of the mobile and industrial markets and do not fit conveniently into either category. Some of these applications include animatronics, wind power, wave power, solar power and amusement park rides. The Company expects its products to continue to be applied in areas outside of traditional mobile or industrial markets.
The Company does not warrant its products for use in any of the following applications, (i) any product that comes under the Federal Highway Safety Act, such as steering or braking systems for passenger-carrying vehicles or on-highway trucks, (ii) aircraft or space vehicles, (iii) ordnance equipment, (iv) life support equipment, and (v) any product that, when sold, would be subject to the rules and regulations of the United States Nuclear Regulatory Commission. These “application limitations” have alleviated the need for the Company to maintain the internal bureaucracy necessary to conduct business in these market segments.
Competition
The Company’s competitors include full-line producers and niche suppliers similar to the Company. Most competitors market globally. Full-line producers have the ability to provide total hydraulic systems to their customers, including components functionally similar to those manufactured by Sun. The industry has experienced significant consolidation in recent years. Notably, large, full-line producers have acquired most of the independent screw-in hydraulic cartridge valve companies.
Most of the Company’s competitors produce screw-in cartridge valves that fit an industry common cavity that sometimes allows their products to be interchangeable. The industry common cavity is not currently supported by any national or global standards organizations, although there is an ongoing effort to standardize a modified version of this cavity in the United States. The International Standards Organization (ISO) has a standard screw-in cartridge cavity that is different from the industry common cavity, but the Company is not aware of any major competitor that currently produces a full line of standard products conforming to the ISO standard. The Company does not manufacture a product that fits either the industry common or the ISO standard cavity. Some competitors manufacture selected screw-in cartridge valves that fit the Company’s cavity. (See Risk Factors: The marketplace could adopt an industry standard cavity.)
A new class of competitors is emerging in low cost production areas such as Asia and Eastern Europe. These competitors will typically copy both the Company’s products and like products designed by competitors to fit industry common cavities. One of the barriers to these offshore competitors gaining a foothold in established markets are suitable channels or route to market. The Company recognizes this new class of competitor exists and will continue to monitor its growth and impact.
The Company believes that it competes based upon the quality, reliability, price, value, speed of delivery and technological characteristics of its products and services.
Employees
As of December 31, 2011, Sun had 717 full-time employees in the United States, 36 at HCT, 68 in England, 36 in Germany, two in France, 33 in Korea, two in India and three in China. Over 90% of its employees are engaged in manufacturing, distribution, and engineering functions. No employees are represented by a union in any of the Company’s operating units, and management believes that relations with its employees are good. Employees are paid either hourly or with an annual salary at rates that are competitive with other companies in the industry and geographic areas in which they operate. Management believes that Sun’s culture, competitive salaries and wages, above average health and retirement plans, and its safe and pleasant working environment discourage employee turnover and encourage efficient, high-quality production. Nevertheless, due to the nature of the Company’s manufacturing business, it is sometimes difficult to attract skilled personnel. (See Risk Factors: We are dependent upon key employees and skilled personnel.)
Patents and Trademarks
The Company believes that the growth of its business is dependent upon the quality and functional performance of its products and its relationship with the marketplace, rather than the extent of its patents and trademarks. The Company’s principal trademark is registered internationally in the following countries: Argentina, Australia, Brazil, Canada, Chile, China, France, Germany, India, Italy, Japan, Korea, Mexico, Peru, Spain, Sweden, Switzerland, the United Kingdom, the United States and the European Union. While the Company believes that its patents have significant value, the loss of any single patent would not have a material adverse effect on the Company.
8
Available Information
The Company’s annual report on Form 10-K, quarterly reports on Form 10-Q, current reports on Form 8-K, and amendments to those reports, as well as its proxy statements and other materials which are filed with or furnished to the Securities and Exchange Commission (“SEC”) are made available, free of charge, on or through the Sun website under the heading “Investor Relations - Reports - SEC Filings,” as soon as reasonably practicable after they are filed with, or furnished to, the SEC.
ITEM 1A. - RISK FACTORS
FACTORS INFLUENCING FUTURE RESULTS - FORWARD-LOOKING STATEMENTS This Annual Report contains “forward-looking statements” (within the meaning of the Private Securities Litigation Reform Act of 1995) that are based on current expectations, estimates, forecasts, and projections, our beliefs, and assumptions made by us, including (i) our strategies regarding growth, including our intention to develop new products; (ii) our financing plans; (iii) trends affecting our financial condition or results of operations; (iv) our ability to continue to control costs and to meet our liquidity and other financing needs; (v) the declaration and payment of dividends; and (vi) our ability to respond to changes in customer demand domestically and internationally, including as a result of standardization. In addition, we may make other written or oral statements, which constitute forward-looking statements, from time to time. Words such as “may,” “expects,” “projects,” “anticipates,” “intends,” “plans,” “believes,” “seeks,” “estimates,” variations of such words, and similar expressions are intended to identify such forward-looking statements. Similarly, statements that describe our future plans, objectives or goals also are forward-looking statements. These statements are not guarantees of future performance and are subject to a number of risks and uncertainties, including those discussed below and elsewhere in this report. Our actual results may differ materially from what is expressed or forecasted in such forward-looking statements, and undue reliance should not be placed on such statements. All forward-looking statements are made as of the date hereof, and we undertake no obligation to update any forward-looking statements, whether as a result of new information, future events or otherwise.
Factors that could cause actual results to differ materially from what is expressed or forecasted in such forward-looking statements include, but are not limited to: (i) conditions in the capital markets, including the interest rate environment and the availability of capital; (ii) changes in the competitive marketplace that could affect our revenue and/or cost bases, such as increased competition, lack of qualified engineering, marketing, management or other personnel, and increased labor and raw materials costs; (iii) new product introductions, product sales mix and the geographic mix of sales nationally and internationally; and the following risk factors:
Sales in our industry are subject to economic cycles. The capital goods industry in general, and the hydraulics industry in particular, are subject to economic cycles, which directly affect customer orders, lead times and sales volume. Economic downturns generally have a material adverse effect on our business and results of operations, as they did in 2009. Cyclical economic expansions such as those of 2010 and 2011, provide a context where demand for capital goods is stimulated, creating increased demand for the products we produce. In the future, continued weakening or improvement in the economy will directly affect orders and influence results of operations.
We are subject to intense competition. The hydraulic valve industry is intensely competitive, and competition comes from a large number of companies, some of which are full-line producers and others that are niche suppliers like us. Full-line producers have the ability to provide total hydraulic systems to customers, including components functionally similar to those manufactured by us. We believe that we compete based upon quality, reliability, price, value, speed of delivery and technological characteristics. Many screw-in cartridge valve competitors are owned by corporations that are significantly larger and have greater financial resources than we have. We cannot assure that we will continue to be able to compete effectively with these companies.
9
Most of Sun’s competitors either manufacture manifolds or have sources that they use on a regular basis. In addition, there are many independent manifold suppliers that produce manifolds incorporating various manufacturers’ screw-in cartridge valves, including those made by us. Finally, there are many small, independent machine shops that produce manifolds at very competitive prices. We believe that competition in the manifold and integrated package business is based upon quality, price, performance, proximity to the customer and speed of delivery. Many competitors have very low overhead structures and we cannot assure that we will be able to continue to compete effectively with these companies.
In addition, we compete in the sale of hydraulic valves, manifolds and integrated packages with certain of our customers, who also may be competitors. Generally, these customers purchase cartridge valves from us to meet a specific need in a system that cannot be filled by any valve they make themselves. To the extent that we introduce new products in the future that increase competition with such customers, it may have an adverse effect on our relationships with them.
We are subject to risks relating to international sales. In 2011, approximately 60% of our net sales were outside of the United States. International sales have continued to represent a greater proportion of our consolidated sales. We will continue to expand the scope of operations outside the United States, both through direct investment and distribution, and expect that international sales will continue to account for a substantial portion of net sales in future periods. International sales are subject to various risks, including unexpected changes in regulatory requirements and tariffs, longer payment cycles, difficulties in receivable collections, potentially adverse tax consequences, trade or currency restrictions, and, particularly in emerging economies, potential political and economic instability and regional conflicts.
Furthermore, our international operations generate sales in a number of foreign currencies, particularly British pounds, the Euro, and the Korean Won. Therefore, our financial condition and results of operations can be affected by fluctuations in exchange rates between the United States dollar and these currencies. Any or all of these factors could have a material adverse effect on our business, financial condition and results of operations.
We are subject to various risks relating to our growth strategy. In pursuing our growth strategy, we intend to expand our presence in existing markets and enter new markets. In addition, we may pursue acquisitions and joint ventures to complement our business. Many of the expenses arising from expansion efforts may have a negative effect on operating results until such time, if at all, that these expenses are offset by increased revenues. We cannot assure that we will be able to improve our market share or profitability, recover our expenditures, or successfully implement our growth strategy. See “Item 1. - Business - Strategy.”
The expansion strategy also may require substantial capital investment for the construction of new facilities and their effective operation. We may finance the acquisition of additional assets using cash from operations, bank or institutional borrowings, or through the issuance of debt or equity securities. We cannot assure that we will be able to obtain financing from bank or institutional sources or through the equity or debt markets or that, if available, such financing will be on acceptable terms.
Our culture, by encouraging initiative, and both individual and collaborative responsibility, has substantially contributed to our success and operating results. Because our employees are able to readily shift their job functions to accommodate the demands of the business and changes in the market, we are a nimble, creative and innovative organization. As we increase the number of our employees and grow into new geographic markets, our culture will likely shift and evolve in new ways. Because our culture promotes the drivers of our success, our inability to protect and align our core values and culture with the evolving needs of the business could adversely affect our continued success.
We are dependent upon key employees and skilled personnel. Our success depends, to some extent, upon a number of key individuals. The loss of the services of one or more of these individuals could have a material adverse effect on our business. Future operating results depend to a significant degree upon the continued contribution of key management and technical personnel and the skilled labor force. As the Company continues to expand internationally, additional management and other key personnel will be needed. Competition for management and engineering personnel is intense and other employers may have greater financial and other resources to attract and retain these employees. We conduct a substantial part of our operations in Sarasota, Florida. Continued success is dependent on the Company’s ability to attract and retain a skilled labor force at this location. There are no assurances that we will continue to be successful in attracting and retaining the personnel required to develop, manufacture and market our products and expand our operations. See “Item 1. - Business - Employees.”
We are subject to fluctuations in the prices of raw materials. The primary raw materials used in the manufacture of our products are aluminum, ductile iron and steel. We cannot assure that prices for such materials will not increase or, if they do, that we will be able to increase the prices for our products to maintain our profit margins. If future price increases do not adequately cover material cost increases, our operating results may be adversely affected.
10
We are dependent upon our parts suppliers. Our largest expense in cost of sales is the cost of purchasing cartridge valve parts. We cannot assure you that our manufacturing costs and output would not be materially and adversely affected by operational or financial difficulties experienced by one or more of our suppliers.
We are subject to risks relating to our information technology systems. We rely extensively on information technology systems to manage and operate our business. We cannot assure you that our results of operations and financial condition would not be materially and adversely affected if we experienced a significant business disruption due to the failure of these systems to function properly, or unauthorized access to our systems.
Hurricanes could cause a disruption in our operations which could adversely affect our business, results of operations, and financial condition. A significant portion of our operations are located in Florida, a region that is susceptible to hurricanes. Such weather events can cause disruption to our operations and could have a material adverse effect on our overall results of operations. While we have property insurance to partially reimburse us for wind losses resulting from a named storm, such insurance would not cover all possible losses.
We are subject to risks relating to changes in our tax rates, unfavorable resolution of tax contingencies, or exposure to additional income tax liabilities. We are subject to income taxes in the United States and various non-U.S. jurisdictions. Domestic and international tax liabilities are subject to the allocation of income among various tax jurisdictions. Our effective tax rate could be affected by changes in the mix among earnings in countries with differing statutory tax rates or changes in tax laws. We are subject to on-going tax audits in various jurisdictions. If these audits result in assessments different from amounts reserved, future financial results may include unfavorable adjustments to our tax liabilities, which could have a material adverse effect on our results of operations.
The marketplace could adopt an industry standard cavity that would not accommodate our products. Our screw-in cartridge valves fit into a unique cavity for which, to date, few other manufacturers have designed products. Accordingly, our screw-in cartridge valves are not interchangeable with those of other manufacturers. Most competitive manufacturers produce screw-in cartridge valves that fit into an industry common cavity. There is an ongoing effort in the United States to produce a standard for screw-in hydraulic cartridge valve cavities based on the industry common cavity. Additionally, the International Standards Organization (“ISO”) has an existing industry standard for screw-in hydraulic cartridge valve cavities, which is different from our cavity and the industry common cavity. In our view, the industry common cavity, as well as the suggested standardized form of this cavity, and the ISO standard cavity, fail to address critical functional requirements, which could result in performance and safety problems of significant magnitude for end users. To our knowledge, no major competitor has converted its standard product line to fit the ISO standard cavity. Any move by a substantial number of screw-in cartridge valve and manifold manufacturers toward the adoption of ISO standard or another standard, based on the existing industry common cavity, could have a material adverse effect on our business, financial condition and results of operation. See “Item 1. - Business - Competition.”
We are subject to the cost of environmental compliance and the risk of failing to comply with environmental laws. Our operations involve the handling and use of substances that are subject to federal, state and local environmental laws and regulations that impose limitations on the discharge of pollutants into the soil, air and water and establish standards for their storage and disposal. We believe that our current operations are in substantial compliance with applicable environmental laws and regulations, the violation of which could have a material adverse effect on our business, financial condition and results of operations. New laws and regulations, or stricter interpretations of existing laws or regulations, could have a material adverse affect on our business, financial condition and results of operations. We have not suffered any material adverse effects due to compliance with environmental laws and regulations in the past.
We are subject to the risk of liability for defective products. The application of many of our products entails an inherent risk of product liability. We cannot assure you that we will not face any material product liability claims in the future or that the product liability insurance we maintain at such time will be adequate to cover such claims.
11
We may decide to reduce or eliminate dividends. Although we have paid a cash dividend each quarter since our common stock began publicly trading in 1997, we cannot assure that funds will be available for this purpose in the future. The declaration and payment of dividends is subject to the sole discretion of our board of directors and will depend upon our profitability, financial condition, capital needs, acquisition opportunities, future prospects and other factors deemed relevant by the board, and may be restricted by the terms of our credit facilities.
Certain anti-takeover provisions may hinder or prevent a change in control. Our Articles of Incorporation provide for a classified board of directors. In addition, the Articles give the board of directors the authority, without further action by the shareholders, to issue and fix the rights and preferences of a new class, or classes, of preferred stock. These and other provisions of the Articles and our Bylaws may deter or delay changes in control, including transactions in which shareholders might otherwise receive a premium for their shares over then current market prices. In addition, these provisions may limit the ability of shareholders to approve transactions that they may deem to be in their best interests.
We are subject to control by certain shareholders and management. Christine L. Koski, the daughter of the deceased founder of the Company, Robert E. Koski, is a member of the board of directors. She, along with other family members, own or control approximately 19% of the outstanding shares of our common stock. Accordingly, the members of the Koski family have the ability to influence significantly the election of our directors and the outcome of certain corporate actions requiring shareholder approval, and to influence our business. Such influence could preclude any acquisition of the Company and could adversely affect the price of our common stock. Our directors and executive officers as a group beneficially own or control approximately 18% of the outstanding shares of our common stock.
ITEM 1B. UNRESOLVED STAFF COMMENTS
None.
ITEM 2. PROPERTIES
The Company owns major facilities in the United States, United Kingdom, Germany, and Korea, as set forth below.
The Company owns a 69,000 square foot facility in Sarasota, Florida, which houses manufacturing, design, marketing and other administrative functions. The Sarasota facility is well suited for the design, testing and manufacture of the Company’s products.
The Company also owns a 77,000 square foot manufacturing facility in Manatee County, Florida. The Manatee County facility, constructed in 1997, has a productive capacity similar to the Sarasota facility.
The close proximity of the Florida facilities allows us to quickly shift resources, including machinery and people, to effectively meet changing business requirements.
The Company also owns vacant land in Manatee County, Florida, adjacent to its existing facility for future expansion requirements. In total, the Company owns 27 acres of contiguous property.
In January 2012, the Company announced that it has applied for permitting to begin site preparation for a planned expansion property. The initial phase of the planned expansion, an infrastructure utility building that will serve both the existing Manatee County facility and the planned new facility, was completed in November 2011. The new facility, when completed, will have 60,000 square feet of manufacturing and 16,000 square feet of office space to create capacity for future growth. The total investment, including the completed infrastructure utility building and site work, is estimated to be approximately $16 million. By completing site preparation work now, Sun will be in position to begin construction, when ready, without delay. However, no decision has been made regarding the timing of the start of the construction phase.
12
The Company leases a 17,000 square foot manufacturing facility in Lenexa, Kansas, which is used to manufacture manifolds for the North American market.
The Company owns a 37,000 square foot facility in Coventry, England. This operation, while primarily acting as a distributor, is also involved in manifold design and manufacturing.
The Company owns a 45,000 square foot distribution and manufacturing facility in Erkelenz, Germany. This facility is well suited to house equipment used for manufacturing and testing of the Company’s products. Currently, a small portion of the manufacturing area is utilized and the remainder is leased on an annual basis to an outside company.
The Company owns a 10,000 square foot distribution and manufacturing facility in Inchon, Korea.
There is no mortgage or other significant encumbrance on any of the Company’s properties. The Company believes that its properties have been adequately maintained, are generally in good condition, and are suitable and adequate for its business as presently conducted. The extent of utilization of the Company’s properties varies from time to time and among its facilities.
ITEM 3. LEGAL PROCEEDINGS
The Company from time to time is involved in routine litigation incidental to the conduct of its business. The Company does not believe that any pending litigation will have a material adverse effect on its consolidated financial position or results of operations.
ITEM 4. MINE SAFETY DISCLOSURE
Not applicable.
13
PART II
ITEM 5. MARKET FOR REGISTRANT’S COMMON EQUITY,
RELATED STOCKHOLDER MATTERS AND
ISSUER PURCHASES OF EQUITY SECURITIES
Market Information
The Common Stock of the Company has been trading publicly under the symbol SNHY on the Nasdaq Global Select Market since the Company’s initial public offering on January 9, 1997. The following table sets forth the high and low closing sale prices of the Company’s Common Stock as reported by the Nasdaq Global Select Market and the dividends declared for the periods indicated.
| High | Low | Dividends declared |
||||||||||
| 2011 | ||||||||||||
| First quarter |
$ | 30.100 | $ | 22.870 | 0.133 | |||||||
| Second quarter |
35.080 | 27.650 | 0.090 | |||||||||
| Third quarter |
33.570 | 20.380 | 0.090 | |||||||||
| Fourth quarter |
30.600 | 19.430 | 0.090 | |||||||||
| 2010 | ||||||||||||
| First quarter |
$ | 19.687 | $ | 13.907 | 0.060 | |||||||
| Second quarter |
21.067 | 15.267 | 0.060 | |||||||||
| Third quarter |
19.300 | 14.867 | 0.060 | |||||||||
| Fourth quarter |
25.600 | 18.373 | 0.393 | |||||||||
Holders
There were 137 shareholders of record of Common Stock on February 24, 2012. The number of record holders was determined from the records of the Company’s transfer agent and does not include beneficial owners of Common Stock whose shares are held in the names of securities brokers, dealers, and registered clearing agencies. The Company believes that there are approximately 8,000 beneficial owners of Common Stock.
Dividends
Quarterly dividends were paid on the 15th day of each month following the date of declaration. Additionally, the Company declared a shared distribution cash dividend of $0.07 per share that was paid on March 31, 2011, to shareholders of record as of March 15, 2011. In 2010, the Company declared a one-time special cash dividend of $0.50 per share that was paid on November 30, 2010, to shareholders of record as of November 15, 2010. The Company’s board of directors has also declared a shared distribution cash dividend of $0.12 per share, payable on March 31, 2012, to shareholders of record as of March 22, 2012. Additionally, the Company’s board of directors declared a first quarter 2012 cash dividend of $0.09 per share payable on April 15, 2012, to shareholders of record as of March 31, 2012.
The Company’s board of directors currently intends to continue to pay a quarterly dividend of $0.09 per share during 2012. However, the declaration and payment of future dividends is subject to the sole discretion of the board of directors, and any determination as to the payment of future dividends will depend upon the Company’s profitability, financial condition, capital needs, acquisition opportunities, future prospects and other factors deemed pertinent by the board of directors.
14
Stock Split
On June 9, 2011, the Company declared a three-for-two stock split, effected in the form of a 50% stock dividend, to shareholders of record on June 30, 2011, payable on July 15, 2011. The Company issued approximately 8,500,000 shares of common stock as a result of the stock split.
On June 19, 2007, the Company declared a three-for-two stock split, effected in the form of a 50% stock dividend, to shareholders of record on June 30, 2007, which was paid on July 15, 2007. The Company issued approximately 5,500,000 shares of common stock as a result of the stock split.
The effect of these stock splits on outstanding shares, earnings per share and dividends per share has been retroactively applied to all periods presented.
Equity Compensation Plans
Information called for by Item 5 is provided in Note 15 of our 2011 Audited Financial Statements (Item 8 of this report).
Issuer Purchases of Equity Securities
The Company did not repurchase any of its stock during the fourth quarter of 2011.
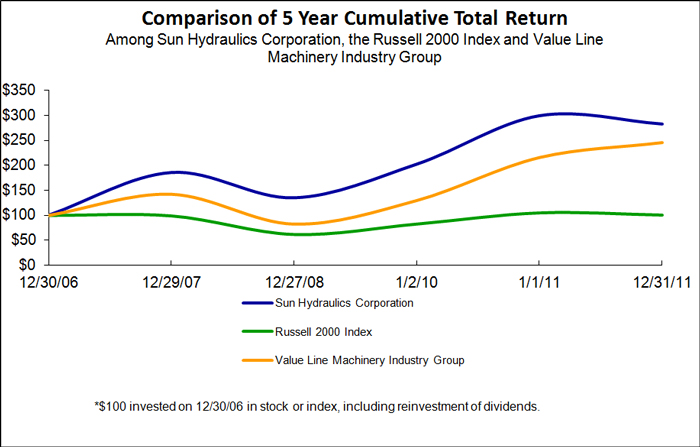
Five-Year Stock Performance Graph
The following graph compares cumulative total return among Sun, the Russell 2000 Index and the Value Line Machinery Industry Group, from December 30, 2006, to December 31, 2011, assuming $100 invested in each on December 30, 2006. Total return assumes reinvestment of any dividends for all companies considered within the comparison. The stock price performance shown in the graph is not necessarily indicative of future price performance.
15
| 12/30/2006 | 12/29/2007 | 12/27/2008 | 1/2/2010 | 1/1/2011 | 12/31/2011 | |||||||||||||||||||
| Sun Hydraulics Corporation |
100.00 | 185.89 | 135.03 | 202.67 | 300.11 | 283.39 | ||||||||||||||||||
| Russell 2000 Index |
100.00 | 99.17 | 62.17 | 82.89 | 105.14 | 100.75 | ||||||||||||||||||
| Value Line Machinery Industry Group |
100.00 | 142.51 | 82.67 | 130.02 | 216.24 | 246.15 | ||||||||||||||||||
ITEM 6. SELECTED CONSOLIDATED FINANCIAL DATA
The following summary should be read in conjunction with the consolidated financial statements and related notes contained herein. See “Item 7. Management’s Discussion and Analysis of Financial Condition and Results of Operations” and “Item 1. Business.”
The Company reports on a fiscal year that ends on the Saturday closest to December 31st. Each quarter generally consists of thirteen weeks. As a result of the 2009 fiscal year ending January 2, 2010, the quarter ended January 2, 2010, consisted of fourteen weeks, resulting in a 53-week year.
16
| Year Ended | ||||||||||||||||||||
| Dec 31, 2011 | Jan 1, 2011 | Jan 2, 2010 | Dec 27, 2008 | Dec 29, 2007 | ||||||||||||||||
| (in thousands except per share data) | ||||||||||||||||||||
| Statement of Operations: |
||||||||||||||||||||
| Net sales |
$ | 204,171 | $ | 150,695 | $ | 97,393 | $ | 178,278 | $ | 167,374 | ||||||||||
| Gross profit |
79,215 | 52,343 | 21,957 | 59,117 | 54,850 | |||||||||||||||
| Operating income |
55,269 | 31,039 | 2,143 | 36,377 | 33,635 | |||||||||||||||
| Income before income taxes |
57,586 | 31,643 | 2,017 | 37,729 | 34,371 | |||||||||||||||
| Net income |
$ | 37,677 | $ | 21,400 | $ | 1,856 | $ | 25,735 | $ | 22,131 | ||||||||||
| Basic net income per common share |
$ | 1.47 | $ | 0.84 | $ | 0.07 | $ | 1.03 | $ | 0.90 | ||||||||||
| Diluted net income per common share |
$ | 1.47 | $ | 0.84 | $ | 0.07 | $ | 1.03 | $ | 0.89 | ||||||||||
| Dividends per common share |
$ | 0.40 | $ | 0.57 | $ | 0.30 | $ | 0.30 | $ | 0.23 | ||||||||||
| Other Financial Data: |
||||||||||||||||||||
| Depreciation and amortization |
$ | 6,721 | $ | 6,873 | $ | 6,968 | $ | 7,096 | $ | 6,341 | ||||||||||
| Capital expenditures |
10,143 | 3,856 | 5,096 | 10,874 | 12,591 | |||||||||||||||
| Balance Sheet Data: |
||||||||||||||||||||
| Cash and cash equivalents |
$ | 51,308 | $ | 33,337 | $ | 30,446 | $ | 35,303 | $ | 19,337 | ||||||||||
| Working capital |
89,744 | 66,150 | 53,454 | 50,217 | 36,198 | |||||||||||||||
| Total assets |
$ | 167,528 | 132,034 | 119,933 | 122,385 | 110,780 | ||||||||||||||
| Total debt |
— | — | — | 272 | 701 | |||||||||||||||
| Shareholders’ equity |
145,276 | 115,024 | 107,614 | 106,556 | 91,882 | |||||||||||||||
17
ITEM 7. MANAGEMENT’S DISCUSSION AND ANALYSIS
OF FINANCIAL CONDITION AND RESULTS OF OPERATIONS
OVERVIEW
Sun is a leading designer and manufacturer of high-performance screw-in hydraulic cartridge valves and manifolds, which control force, speed and motion as integral components in fluid power systems. The Company sells its products globally through wholly owned subsidiaries and independent distributors. Sales outside the United States for the year ended December 31, 2011, were approximately 60% of total net sales.
Approximately two-thirds of product sales are used by the mobile market, which is characterized by applications where the equipment is not fixed in place, the operating environment is often unpredictable and duty cycles are generally moderate to low. Some examples of the mobile market include equipment used in off-road construction, agriculture, fire and rescue, utilities, oil fields, and mining.
The remaining one-third of sales are used by industrial markets, which are characterized by equipment that is fixed in place, typically in a controlled environment, and which operates at higher pressures and duty cycles. Power units, automation machinery, metal cutting machine tools and plastics machinery are some examples of industrial equipment. The Company sells to both markets with a single product line.
Industry Conditions
Demand for the Company’s products is dependent on demand for the capital goods into which the products are incorporated. The capital goods industries in general, and the fluid power industry specifically, are subject to economic cycles. According to the National Fluid Power Association (the fluid power industry’s trade association in the United States), the United States index of shipments of hydraulic products increased 24% and 42% in 2011 and 2010, respectively, after a decrease of 40% in 2009.
The Company’s order trend has historically tracked closely to the United States Purchasing Managers Index (PMI). A PMI above 50 indicates economic expansion in the manufacturing sector and when below 50, it indicates economic contraction. The index decreased to 53.1 in December 2011, from 58.5 in December 2010. The index has remained above 50 since August 2009. The report in February 2012 indicates continuing growth in the manufacturing sector with an index at 52.4. Management believes the continuing growth in the manufacturing sector is a positive sign for the Company’s business in 2012.
During this expansion phase of the business cycle, the Company has experienced significant demand for its products with revenues increasing over 100% from 2009 to 2011. The Company has been able to respond to this increasing demand and consistently ship product on-time to the customer’s requested ship date. Providing the right products where and when the customer needs them, continues to strengthen Sun’s position in the industry.
This increased demand, coupled with an agile workforce, experienced supply chain, and manufacturing processes that are operating smoothly have allowed Sun to operate at high margins. Gross margins in 2011 exceeded 39% for the first three-quarters of the year and were approximately 37% in the fourth quarter. At these sales levels, the Company was able to leverage its fixed cost base and resources, adding additional income to the bottom line. Net income was up 76% in 2011 compared to 2010.
18
Results for the 2011 fiscal year
(Dollars in millions except net income per share)
| December 31, | January 1, | |||||||||||
| 2011 | 2011 | Increase/Decrease | ||||||||||
| Twelve Months Ended |
||||||||||||
| Net Sales |
$ | 204.2 | $ | 150.7 | 35 | % | ||||||
| Net Income |
$ | 37.7 | $ | 21.4 | 76 | % | ||||||
| Net Income per share: |
||||||||||||
| Basic |
$ | 1.47 | $ | 0.84 | 75 | % | ||||||
| Diluted |
$ | 1.47 | $ | 0.84 | 75 | % | ||||||
| Three Months Ended |
||||||||||||
| Net Sales |
$ | 45.7 | $ | 41.8 | 9 | % | ||||||
| Net Income |
$ | 6.1 | $ | 6.3 | -3 | % | ||||||
| Net Income per share: |
||||||||||||
| Basic |
$ | 0.24 | $ | 0.25 | -4 | % | ||||||
| Diluted |
$ | 0.24 | $ | 0.25 | -4 | % | ||||||
Sun grew its top line by 36% in 2011, and the bottom line by 76%. Sales grew in all geographic markets with sales to North America increasing 40.1%, Europe 33.2%, and Asia/Pacific 30.2%.
In addition to strong operational results in 2011, the Company engaged in a number of activities that management believes positions it well to take advantage of future growth opportunities. Sun opened a sales office in China in January 2011, which helped increase sales 49% in this region. Despite an end of year slow down in the region, management expects China to regain its growth trajectory in the long term. Sun added capability and capacity in 2011, notably in the design and manufacturing engineering area. Management believes these additions will help Sun develop the products and processes that will contribute to the Company’s growth. In September 2011, Sun completed its acquisition of 100% of the equity interest of High Country Tek (HCT). HCT products and capabilities integrate nicely with Sun’s line of electrically-actuated hydraulic valves, creating new opportunities in the marketplace.
First quarter demand has rebounded and is forecast to be 5% above last year’s level. Orders are strong in all major geographic regions. Orders coupled with positive PMI numbers indicate growth in 2012. Management believes the Company is positioned well for increasing demand and expects to deliver strong operating results.
Maintaining the Company’s strong balance sheet and financial flexibility remains a key strategy. The Company ended 2011 with cash and marketable securities of $73.1 million, up $28.1 million from the previous year, an unused line of credit of $15.0 million, with availability up to $50.0 million and zero dollars of long-term debt. The Company continued to invest in its business in 2011 with capital expenditures for the year of approximately $10.1 million.
Dividends
The Company declared a quarterly dividend of $0.06 per share for the first quarter of 2011 and quarterly dividends of $0.09 per share for the remaining three quarters of 2011. These dividends were paid on the 15th day of the month following the date of declaration. The Company also declared a shared distribution cash dividend of $0.07 per share that was paid on March 31, 2011, to shareholders of record as of March 15, 2011. Additionally, the Company declared a three-for-two stock split, effected in the form of a 50% stock dividend, to shareholders of record on June 30, 2011, which was paid on July 15, 2011.
19
In March 2012, the Board elected to once again apportion a shared distribution for employees and shareholders based on the Company’s 2011 results. The shared distribution consists of a 13.5% contribution of salaries to all eligible employees, most of which will be paid into retirement plans via Sun Hydraulics Stock, and a $0.12 per share dividend to shareholders, totaling approximately $7.7 million. The shared distribution concept was introduced in 2008 as a way to reward both shareholders and employees when Sun has a successful year.
The shared distribution dividend will be issued to shareholders of record on March 22, 2012, with payment on March 31, 2012. Additionally, the Company’s board of directors declared a first quarter 2012 cash dividend of $0.09 per share payable on April 15, 2012, to shareholders of record as of March 31, 2012.
Outlook
First quarter 2012 revenues are expected to be approximately $53 million, up approximately 5% from the first quarter of 2011. Earnings per share are estimated to be $0.37 to $0.39 compared to $0.38 in the same period a year ago.
Results of Operations
The following table sets forth, for the periods indicated, certain items in the Company’s statements of operations as a percentage of net sales.
| For the Year Ended | ||||||||||||||||||||
| Dec 31, 2011 | Jan 1, 2011 | Jan 2, 2010 | Dec 27, 2008 | Dec 29, 2007 | ||||||||||||||||
| Net sales |
100.0 | % | 100.0 | % | 100.0 | % | 100.0 | % | 100.0 | % | ||||||||||
| Gross profit |
38.8 | % | 34.7 | % | 22.5 | % | 33.2 | % | 32.8 | % | ||||||||||
| Operating income |
27.1 | % | 20.6 | % | 2.2 | % | 20.4 | % | 20.1 | % | ||||||||||
| Income before income taxes |
28.2 | % | 21.0 | % | 2.1 | % | 21.2 | % | 20.5 | % | ||||||||||
20
Segment Information (in thousands)
| United | United | |||||||||||||||||||||||
| States | Korea | Germany | Kingdom | Elimination | Consolidated | |||||||||||||||||||
| 2011 |
||||||||||||||||||||||||
| Sales to unaffiliated customers |
$ | 131,714 | $ | 20,566 | $ | 27,997 | $ | 23,894 | $ | — | $ | 204,171 | ||||||||||||
| Intercompany sales |
33,711 | — | 201 | 1,536 | (35,448 | ) | — | |||||||||||||||||
| Operating income |
41,847 | 2,492 | 6,715 | 4,167 | 48 | 55,269 | ||||||||||||||||||
| Total assets |
116,496 | 11,996 | 19,016 | 20,747 | (727 | ) | 167,528 | |||||||||||||||||
| Depreciation and amortization |
5,308 | 114 | 357 | 942 | 6,721 | |||||||||||||||||||
| Capital expenditures |
9,324 | 274 | 63 | 482 | 10,143 | |||||||||||||||||||
| 2010 |
||||||||||||||||||||||||
| Sales to unaffiliated customers |
$ | 94,067 | $ | 16,284 | $ | 19,770 | $ | 20,574 | $ | — | $ | 150,695 | ||||||||||||
| Intercompany sales |
26,022 | — | 160 | 1,225 | (27,407 | ) | — | |||||||||||||||||
| Operating income |
22,040 | 2,246 | 4,024 | 2,822 | (93 | ) | 31,039 | |||||||||||||||||
| Total assets |
89,977 | 10,535 | 14,705 | 17,605 | (788 | ) | 132,034 | |||||||||||||||||
| Depreciation and amortization |
5,388 | 89 | 429 | 967 | 6,873 | |||||||||||||||||||
| Capital expenditures |
3,400 | 217 | 27 | 212 | 3,856 | |||||||||||||||||||
| 2009 |
||||||||||||||||||||||||
| Sales to unaffiliated customers |
$ | 59,278 | $ | 9,978 | $ | 14,654 | $ | 13,483 | $ | — | $ | 97,393 | ||||||||||||
| Intercompany sales |
15,545 | — | 139 | 1,101 | (16,785 | ) | — | |||||||||||||||||
| Operating income (loss) |
(2,110 | ) | 616 | 2,475 | 884 | 278 | 2,143 | |||||||||||||||||
| Total assets |
85,338 | 8,191 | 12,447 | 15,923 | (1,966 | ) | 119,933 | |||||||||||||||||
| Depreciation and amortization |
5,335 | 104 | 502 | 1,027 | 6,968 | |||||||||||||||||||
| Capital expenditures |
4,758 | 41 | 30 | 267 | 5,096 | |||||||||||||||||||
21
Comparison of Years Ended December 31, 2011 and January 1, 2011
Net Sales
Net sales were $204.2 million, an increase of $53.5 million, or 35.5%, compared to $150.7 million in 2010. The increase in net sales was primarily driven by increased demand in our end markets, which primarily include capital goods equipment. Price increases, effective July 1, 2010, and 2011, contributed approximately 3% to sales. The effect of exchange rates added approximately $2.6 million to sales. New product sales (defined as products introduced within the last five years) generally made up 10-12% of total sales in 2011.
North American sales increased 40.1% or $27.0 million, to $94.2 million in 2011, Asian sales increased 29.3% or $8.8 million, to $38.8 million in 2011, and European sales increased 33.2% or $15.8 million, to $63.4 million in 2011.
The U.S. reporting segment had sales of $131.7 million during 2011, up $37.6 million or 40.0%, compared to sales of $94.1 million during 2010. The increase was driven by demand in our end markets and the general upturn in the global economy. International sales out of the U.S. were $49.8 million during 2011, up 42.3% or $14.8 million, compared to $34.9 million during 2010. International sales out of the US include sales to Europe, Africa and the Asia/Pacific region. Significant increases in sales were noted in almost all geographic regions.
The Korean reporting segment had sales of $20.6 million during 2011, up $4.3 million or 26.3%, compared to sales of $16.3 million during 2010. The increase was related to demand in almost all market segments. Currency effect increased 2011 sales by approximately $0.9 million, the majority of which occurred in the second and third quarters of the year.
The German reporting segment had sales of $28.0 million during 2011, up $8.2 million or 41.6%, compared to sales of $19.8 million during 2010. The increases in sales were primarily related to an increased demand for our products within Germany. Currency effect increased 2011 sales by approximately $1.4 million, the majority of which occurred in the second and third quarters of the year.
The U.K. reporting segment had sales of $23.9 million during 2011, up $3.3 million or 16.1%, compared to sales of $20.6 million during 2010. The increase was primarily related to sales within the U.K, and to Norway. Currency effect increased 2011 sales by approximately $0.3 million.
Gross Profit
Gross profit increased $26.9 million or 51.3% to $79.2 million in 2011, compared to $52.3 million in 2010. Gross profit as a percentage of net sales increased to 38.8% in 2011, compared to 34.7% in 2010. As sales increased across all segments, the Company achieved productivity improvements and was able to leverage its overhead costs to generate higher gross profit.
Higher sales volume in 2011 contributed $16.3 million of the increase. The remaining increase in gross profit was attributed to productivity improvements of approximately $0.8 million, decreases in overhead expenses as a percentage of sales of approximately $5.1 million, both of which occurred primarily in the U.S., and price increases in July 2010 and 2011, of approximately $6.8 million. The increase in gross profit was partially offset by higher material costs as a percentage of sales of approximately $2.0 million.
Current year overhead expense includes approximately $1.4 million more expense relating to the shared distribution as compared to the prior year.
Selling, Engineering, and Administrative Expenses
Selling, engineering and administrative expenses in 2011 were $23.9 million, a $2.6 million, or 12.4%, increase, compared to $21.3 million in 2010. The change was related to additional retirement benefits of approximately $0.5 million, primarily related to the shared distribution, compensation, totaling $0.8 million, marketing expenses of approximately $0.4 million, and outside services of approximately $0.2 million.
22
Operating Income
Operating income increased $24.2 million or 78.1% to $55.3 million in 2011, compared to $31.0 million in 2010, with operating margins of 27.1% and 20.6% for 2011 and 2010, respectively. The increase in sales during 2011 has improved operating margins across almost all segments. The Company has been able to respond to the increasing demand in 2011. As sales increased across all segments, the Company achieved productivity improvements and was able to leverage its overhead costs to generate higher operating income.
The U.S. reporting segment contributed $41.8 million to our consolidated operating income during 2011 compared to $22.0 million during 2010, an increase of $19.8 million.
The increase in the U.S. operating segments was primarily related to leverage of its overhead costs. The decrease in variable and fixed overhead costs, as a percent of sales, added $5.8 million to operating income. Absorption of selling, engineering, and administrative expenses added $4.0 million of additional operating income. Productivity gains contributed $1.0 million. The remaining increase was primarily from increased sales volume, which added $8.8 million of additional operating income.
The Korean reporting segment contributed $2.5 million to our consolidated operating income during 2011 compared to $2.2 million during 2010, an increase of $0.2 million. The increase in operating income was primarily related to increased sales volume, which was partially offset by lower margins.
The German reporting segment contributed $6.7 million to our consolidated operating income during 2011 compared to $4.0 million during 2010, an increase of $2.7 million. The increase was primarily related to increased sales volume, which contributed $1.7 million of additional operating income. The remaining increase was related to the absorption of fixed overhead costs.
The U.K. reporting segment contributed $4.2 million to our consolidated operating income during 2011 compared to $2.8 million during 2010, an increase of $1.3 million. The increase was primarily related to decreased material costs of $0.5 million, productivity improvements of $0.2 million and decreased variable and fixed costs as a percent of sales of $0.2 million. The increase in sales volume resulted in $0.5 million of additional operating income.
Interest Income, Net
Net Interest income for 2011 was $0.8 million compared to net interest income of $0.7 million for 2010. Total average cash and marketable securities for 2011, was $59.0 million compared to total average cash and marketable securities of $41.6 million for 2010. Although total cash and marketable securities increased in 2011, interest rates were at an all-time low. Interest is primarily derived from investments in corporate and municipal bonds, mutual funds, certificates of deposit, and money market funds.
Foreign Currency Transaction (Gain) Loss, Net
Net foreign currency transaction gain was $0.2 million in 2011 compared to a loss of $0.1 million in 2010. The U.S. Dollar weakened against the Euro, the Korean Won and the British Pound at times during 2011, resulting in foreign currency transaction gains at each of our international locations.
Miscellaneous (Income) Expense, Net
Miscellaneous income was $1.4 million in 2011 compared to $0.1 million in 2010. The current period amount includes a gain of $1.2 million as a result of remeasuring to fair value its 38% equity interest in HCT held before the business combination. The remaining 2011 income was related to the gain on the sale of the Chinese joint venture company.
23
Income Taxes
The provision for income taxes for the year ended December 31, 2011, was 34.6% of pretax income compared to a provision of 32.4% for the year ended January 1, 2011. The change was primarily due to the relative levels of income and different tax rates in effect among the countries in which the Company sells its products. The current year provision was affected by discrete items related to a reserve for uncertain tax positions from previous years. Excluding these discrete items, the effective rate would have been approximately 33.8%.
Comparison of Years Ended January 1, 2011, and January 2, 2010
Net Sales
Net sales were $150.7 million, an increase of $53.3 million, or 54.7%, compared to $97.4 million in 2009. Net sales increased 54.8% excluding the effect of exchange rates. The increase in net sales was primarily driven by increased demand in our end markets, which primarily include capital goods equipment. Price increases instituted in July 2010 accounted for approximately 1.5% of total sales. New product sales (defined as products introduced within the last five years) generally made up 10-15% of total sales in 2010.
North American sales increased 51.3% or $22.8 million, to $67.3 million in 2010, Asian sales increased 74.2% or $12.8 million, to $30.1 million in 2010, and European sales increased 46.9% or $15.2 million, to $47.7 million in 2010.
The U.S. reporting segment had sales of $94.1 million during 2010, up $34.8 million or 58.7%, compared to sales of $59.3 million during 2009. The increase was driven by demand in our end markets and the general upturn in the global economy. International sales out of the U.S. were $34.9 million during 2010, up 83.7% or $15.9 million, compared to $19.0 million during 2009. International sales out of the US include sales to Europe, Africa and the Asia/Pacific region. Significant increases in sales were noted in almost all geographic regions.
The Korean reporting segment had sales of $16.3 million during 2010, up $6.3 million or 63.2%, compared to sales of $10.0 million during 2009. Currency effect increased 2010 sales by approximately $1.4 million, the majority of which occurred in the first half of the year. The remaining increase was the result of efforts to expand and diversify the customer base, in addition to increased demand from existing customers.
The German reporting segment had sales of $19.8 million during 2010, up $5.1 million or 34.9%, compared to sales of $14.7 million during 2009. The increase in sales was primarily related to demand within Germany. However increased sales were noted throughout most of Europe. These increases were partially offset by currency effect, which reduced 2010 sales by approximately $1.0 million, most of which occurred in the second half of the year.
The U.K. reporting segment had sales of $20.6 million during 2010, up $7.1 million or 52.6%, compared to sales of $13.5 million during 2009. The increase was primarily related to sales within the U.K, and to Sweden. Currency effect reduced 2010 sales by approximately $0.4 million.
Gross Profit
Gross profit increased $30.4 million or 138.4% to $ 52.3 million in 2010, compared to $22.0 million in 2009. Gross profit as a percentage of net sales increased to 34.7% in 2010, compared to 22.5% in 2009.
During the downturn of the prior year, the Company maintained its workforce and labor and variable overhead costs became essentially fixed. By maintaining its workforce, the Company has been able to respond to the increasing demand in 2010. As sales increased across all segments, the Company has experienced productivity improvements and was able to leverage its overhead costs to generate higher gross profit.
Higher sales volume in 2010 contributed $11.4 million of the gross profit increase. The remaining increase in gross profit was attributed to productivity improvements of approximately $4.5 million, and decreases in overhead expenses as a percentage of sales of approximately $13.3 million, both of which occurred primarily in the U.S. A price increase in July 2010 added approximately $2.6 million to gross profit. The
24
increase in gross profit was partially offset by higher material costs as a percentage of sales of $1.4 million. Additionally, 2010 amounts include higher benefit costs of approximately $1.9 million relating to the shared distribution, most of which will be paid into retirement plans.
In June 2009, the Company initiated rolling furloughs for the production workforce and a 3% salary reduction for non-production personnel. Production employees were brought back throughout the first quarter of 2010 as demand increased. In April 2010, the Company ended its employee furlough program and restored the 3% salary decrease for all U.S. employees. There was minimal impact during 2010 relating to the furloughs and salary reductions, however, there were cost savings of approximately $1.3 million in the prior year.
Selling, Engineering, and Administrative Expenses
Selling, engineering and administrative expenses in 2010 were $21.3 million, a $1.5 million, or 7.5%, increase, compared to $19.8 million in 2009. The increase is primarily related to marketing efforts in Asia of approximately $0.4 million, and additional benefits related to the shared distribution of approximately $0.8 million, most of which will be paid into retirement plans. In the prior year, the cost savings of approximately $0.9 million resulted from furlough and salary reductions.
Operating Income
Operating income increased $28.9 million or 1348.4% to $31.0 million in 2010, compared to $2.1 million in 2009, with operating margins of 20.6% and 2.2% for 2010 and 2009, respectively. Based on the Company’s structure and decisions during the downturn, the increase in sales during 2010 has improved operating margins across all segments. During the downturn of the prior year, the Company maintained its workforce and labor and variable overhead costs became essentially fixed. By maintaining its workforce, the Company has been able to respond to the increasing demand. As sales increase across all segments, the Company is experiencing productivity improvements and is able to leverage its overhead costs to generate higher operating income.
The U.S. reporting segment contributed $22.0 million to our consolidated operating income during 2010 compared to an operating loss of $2.1 million during 2009, an increase of $24.2 million. The increase in the U.S. operating segment is primarily related to productivity gains and leverage of its overhead costs. Productivity gains contributed $4.5 million and decreases in variable and fixed overhead costs as a percent of sales added $13.8 million to operating income. The remaining increases in operating income were primarily from absorption of selling, engineering, and administrative expenses.
The Korean reporting segment contributed $2.2 million to our consolidated operating income during 2010 compared to $0.6 million during 2009, an increase of $1.6 million. The increase in operating income was primarily related to material costs due to the strength of the Korean Won against the U.S. Dollar for material purchases made in U.S. Dollars, and productivity improvements totaling $1.0 million. The increase in sales volume resulted in $0.4 million of additional operating income.
The German reporting segment contributed $4.0 million to our consolidated operating income during 2010 compared to $2.5 million during 2009, an increase of $1.5 million. The increase was primarily due to the absorption of selling, engineering, and administrative expenses which remained flat in whole dollars. The increase in sales volume resulted in $0.9 million of additional operating income. These amounts were offset by material costs, due to the weakening of the Euro against the U.S. Dollar for material purchases made in U.S. Dollars of $0.6 million.
The U.K. reporting segment contributed $2.8 million to our consolidated operating income during 2010 compared to $0.9 million during 2009, an increase of $1.9 million. The increase was primarily related to productivity improvements of $0.8 million and decreased variable and fixed costs as a percent of sales of $1.7 million. The increase in sales volume resulted in $0.5 million of additional operating income. These amounts were partially offset by increased material costs of $1.6 million, primarily related to product mix.
25
Interest Income, Net
Net Interest income for 2010 was $0.7 million compared to net interest income of $0.6 million for 2009. Total average cash and marketable securities for 2010, was $41.6 million compared to total average cash and marketable securities of $36.8 million for 2009. Although total cash and marketable securities increased in 2010, interest rates were at an all time low. Interest is primarily derived from investments in corporate and municipal bonds, mutual funds, certificates of deposit, and money market funds.
Foreign Currency Transaction Loss, Net
Net foreign currency transaction loss was $0.1 million in 2010 compared to $0.3 million in 2009. The U.S. Dollar strengthened against the Euro, the Korean Won and the British Pound at times during 2010 resulting in minimal foreign currency transaction losses at each of our international locations.
Miscellaneous (Income) Expense, Net
Miscellaneous income was $0.1 million in 2010 compared to expense of $0.4 million in 2009. The increase is primarily related to equity method investment earnings.
Income Taxes
The provision for income taxes for the year ended January 1, 2011, was 32.4% of pretax income compared to a provision of 8.0% for the year ended January 2, 2010. The change was primarily due to the relative levels of income and different tax rates in effect among the countries in which the Company sells its products. The prior year provision includes a tax benefit for losses recognized in the U.S.
Liquidity and Capital Resources
Historically, the Company’s primary source of capital has been cash generated from operations, although short-term fluctuations in working capital requirements have been met through borrowings under revolving lines of credit as needed. The Company’s principal uses of cash have been paying operating expenses, paying dividends to shareholders, making capital expenditures, and servicing debt.
Net cash flow from operations in 2011 was $49.5 million, compared to $25.1 million in 2010 and $13.7 million in 2009. The $24.5 million increase in the Company’s net cash flow from operations was due primarily to the increase in net income of $16.3 million, and changes in working capital relating to accounts receivable, inventories, accounts payable and accrued expenses. Increases in inventory, accounts payable and accrued expenses are primarily related to the improved general business conditions during the period. The decrease in accounts receivable for the year is a result of the Company improving in its days sales outstanding. Days sales outstanding decreased to 29 in 2011 from 32 in 2010 and inventory turns remained constant at 10.6. Cash on hand increased $18.0 million from $33.3 million in 2010 to $51.3 million in 2011. Investments in marketable securities increased $10.2 million from $11.6 million in 2010 to $21.8 million in 2011. The $11.4 million increase in the Company’s net cash flow from operations in 2010 was due primarily to the increase in net income of $19.5 million.
Capital expenditures, consisting primarily of purchases of machinery and equipment, were $6.1 million in 2011, compared to $3.9 million in 2010 and $3.4 million in 2009. Also included in capital expenditures for the year ended December 31, 2011 was a building expansion of $1.0 million and an infrastructure utility building of $3.0 million. Included in capital expenditures for the year ended January 2, 2010 was a land purchase equal to $1.7 million.
The Company continues to be watchful of both its capability and capacity, and recognizes that additional capacity may be required as the expansion of this business cycle and its market share gains continue. In January 2012, the Company applied for permitting to begin site preparation for a planned expansion on property the Company currently owns. By completing site preparation work now, Sun will be in position to begin construction, when ready and without delay. However, no decision has been made regarding the timing of the start of the construction phase.
26
The new facility, when completed, will have 60,000 square feet of manufacturing and 16,000 square feet of office space. The total investment, including the completed infrastructure utility building and site work, is estimated to be approximately $16.0 million.
At this time, capital expenditures for 2012 are estimated to be $10 million, which include approximately $3 for site preparation, and $2 million for an expansion and update of our UK facility. The remaining expenditures consist of purchases of machinery and equipment.
Effective August 1, 2011, the company completed a credit and security agreement in the U.S. with Fifth Third Bank (the “Bank”). The new agreement provides for three separate credit facilities totaling $50 million.
Facility A is a $15 million unsecured revolving line of credit and requires monthly payments of interest. Facility A has a floating interest rate of 1.45% over the 30-day LIBOR Rate (as defined).
Facility B is an accordion feature to increase the revolving line of credit to a $35 million secured revolving line of credit. Facility B will be secured by the Company’s U.S. assets, including its manufacturing facilities, and requires monthly payments of interest. Facility B will bear interest at the 30-day LIBOR Rate or the Bank’s Base Rate (as defined), at the Company’s discretion, plus a margin based on the Borrower’s Funded Debt to EBITDA Leverage Ratio (as defined). The LIBOR Margin ranges from 1.45% to 2.25% and the Bank’s Base Rate ranges from -0.25% to 0.00%.
Facility C is a $15 million construction and term loan. Facility C requires monthly payments of interest for the first 24 months and monthly payments of principal plus accrued interest for 60 months based upon a 15 year amortization schedule. The Construction Loan bears interest at the 30-day LIBOR Rate or the Bank’s Base Rate, at the Company’s discretion, plus a margin based on the Borrower’s Funded Debt to EBITDA Leverage Ratio. The LIBOR Margin ranges from 1.65% to 2.45% and the Bank’s Base Rate ranges from -0.05% to 0.20%.
Facility A or Facility B (if activated) is payable in full on August 1, 2016. Facility C is payable seven years after the closing of the facility. Maturity may be accelerated by the Bank upon an Event of Default (as defined). Prepayment may be made without penalty or premium at any time upon the required notice to the Bank.
Facility A is subject to debt covenants (capitalized terms are defined therein) including: 1) Minimum Tangible Net Worth of not less than $92 million, increased annually by 50% of Net Income, and 2) Minimum EBITDA of not less than $5 million; and requires the Company to maintain its primary domestic deposit accounts with the bank.
If Facility B or Facility C is activated, covenant 2 above will automatically terminate and two additional covenants will be required: 1) Funded Debt to EBITDA ratio equal to or less than 3.0:1.0, and 2) EBIT to Interest Expense ratio of not less than 2.5:1.0.
As a result of the acquisition of HCT on September 27, 2011, the Company acquired a line of credit equal to $100,000. Interest on the line of credit is equal to Prime plus 5%. The Company cancelled this line of credit in the fourth quarter.
27
The Company declared the following regular quarterly dividends to shareholders of record on the last calendar day of the respective quarter:
| 2011 | 2010 | 2009 | ||||||||||
| First quarter |
$ | 0.060 | $ | 0.060 | $ | 0.060 | ||||||
| Second quarter |
0.090 | 0.060 | 0.060 | |||||||||
| Third quarter |
0.090 | 0.060 | 0.060 | |||||||||
| Fourth quarter |
0.090 | 0.060 | 0.060 | |||||||||
These dividends were paid on the 15th day of each month following the date of declaration.
In addition to the regular quarterly dividends, the Company declared shared distribution cash dividends in 2011 and 2009, equal to $0.07 and $0.06, respectively. The 2011 dividend was paid on March 31, 2011 to shareholders of record as of March 15, 2011, and the 2009 dividend was paid on March 31, 2009, to shareholders of record as of March 15, 2009.
In 2010, the Company also declared a one-time special cash dividend of $0.33 per share, paid on November 30, 2010, to shareholders of record as of November 15, 2010.
The Board of Directors has declared a shared distribution cash dividend of $0.12 per share, payable on March 31, 2012, to shareholders of record as of March 22, 2012. The shared distribution was introduced in 2008 as a way to reward both shareholders and employees when the Company has a successful year. Additionally, the Company’s board of directors declared a first quarter 2012 cash dividend of $0.09 per share payable on April 15, 2012, to shareholders of record as of March 31, 2012.
The declaration and payment of future dividends is subject to the sole discretion of the Board of Directors, and any determination as to the payment of future dividends will depend upon the Company’s profitability, financial condition, capital needs, acquisition opportunities, future prospects and other factors deemed pertinent by the board of directors.
The Company believes that cash generated from operations and its borrowing availability under the revolving Line of Credit will be sufficient to satisfy the Company’s operating expenses and capital expenditures for the foreseeable future. In the event that economic conditions were to severely worsen for a protracted period of time, the Company would have several options available to ensure liquidity in addition to increased borrowing. Capital expenditures could be postponed since they primarily pertain to long-term improvements in operations. Additional operating expense reductions also could be made. Finally, the dividend to shareholders could be reduced or suspended.
OTHER MATERIAL COMMITMENTS. Our contractual obligations and debt obligations as of December 31, 2011, are summarized in the table below (in thousands):
| Payments due by Period | ||||||||||||||||||||
| LESS THAN | 1-3 | 3-5 | MORE THAN | |||||||||||||||||
| CONTRACTUAL OBLIGATIONS | TOTAL | 1 YEAR | YEARS | YEARS | 5 YEARS | |||||||||||||||
| Operating leases |
$ | 36 | 36 | — | — | — | ||||||||||||||
| Other long term liabilities (1) |
1,149 | — | 1,149 | — | — | |||||||||||||||
|
|
|
|
|
|
|
|
|
|
|
|||||||||||
| Total contractual obligations |
$ | 1,185 | $ | 36 | $ | 1,149 | $ | — | $ | — | ||||||||||
|
|
|
|
|
|
|
|
|
|
|
|||||||||||
| (1) | Other long term liabilities consist of deferred compensation of $1,149. Deferred compensation relates to Director compensation for attendance at Board meetings. Amounts will be paid upon an individual ceasing to be a Director of the Company or earlier dates selected by the Director as provided in the deferred compensation plan. |
28
Critical Accounting Policies and Estimates
The Company currently only applies judgment and estimates which may have a material effect on the eventual outcome of assets, liabilities, revenues and expenses for impairment of long-lived assets, inventory, goodwill, accruals, and income taxes. The following explains the basis and the procedure for each account where judgment and estimates are applied.
Revenue Recognition
The Company reports revenues, net of sales incentives, when title passes and risk of loss transfers to the customer. The effect of material non-recurring events related to product liabilities is provided for when they become known. The Company has not experienced any material product liabilities in the past.
Impairment of Long-Lived Assets
Long-lived assets, such as property and equipment, and purchased intangibles subject to amortization, are reviewed for impairment whenever events or changes in circumstances indicate that the carrying amount of an asset may not be recoverable. Recoverability of the asset is measured by comparison of its carrying amount to future net cash flows the asset is expected to generate. If such assets are considered impaired, the impairment to be recognized is measured as the amount by which the carrying amount of the asset exceeds its fair value.
Inventory
The Company offers a wide variety of standard products and as a matter of policy does not discontinue products. On an ongoing basis, component parts found to be obsolete through design or process changes are disposed of and charged to material cost. The Company reviews on-hand balances of products and component parts against specific criteria. Products and component parts without usage or that have excess quantities on hand are evaluated. An inventory reserve is then established for the full inventory carrying value of those products and component parts deemed to be obsolete or slow moving. See Note 5 to the Financial Statements for inventory reserve amounts.
Goodwill
The Company acquired its Korean operations in September 1998 using the purchase method. As a result, goodwill is reflected on the Consolidated Balance Sheet. A valuation using a discounted cash flow method was performed at December 31, 2011, and January 1, 2011. It was determined that the value of the goodwill was not impaired. Goodwill arising from the acquisition of HCT on September 27, 2011, consisting of the value of the workforce, synergies and competitive advantages obtained as a result of the acquisition is reflected on the Consolidated Balance Sheet. There have been no events or changes in circumstances that would indicate impairment since the valuation at the time of purchase. There is no assurance that the value of these acquired companies will not decrease in the future due to changing business conditions. See Note 7 to the Financial Statements for goodwill amounts.
Accruals
The Company makes estimates related to certain employee benefits and miscellaneous accruals. Estimates for employee benefit accruals are based on management’s assessment of estimated liabilities related to workers’ compensation, health care benefits and annual contributions to an employee stock ownership plan (“ESOP”), established in 2004 as part of the Company’s retirement plan. Estimates for miscellaneous accruals are based on management’s assessment of estimated liabilities for costs incurred.
The Company accrues for health care benefit costs under a self-funded plan. The Company purchases re-insurance for both specific and aggregate stop losses on claims that exceed $115 thousand on an individual basis and approximately $7.6 million on an aggregate basis.
Income Taxes
The Company’s income tax policy provides for a liability approach under which deferred income taxes are provided for based upon enacted tax laws and rates applicable to the periods in which the taxes become payable. These differences result from items reported differently for financial reporting and income tax purposes, primarily depreciation, accrued expenses and reserves.
29
The Company reports a liability for unrecognized tax benefits resulting from uncertain tax positions taken or expected to be taken in a tax return. The Company recognizes potential interest and penalties related to its unrecognized tax benefits in income tax expense. The Company files U.S. federal income tax returns as well as income tax returns in various states and foreign jurisdictions. The Company is no longer subject to income tax examinations by tax authorities for years prior to 2004 for the majority of tax jurisdictions.
The Company’s federal returns are currently under examination by the Internal Revenue Service (IRS) in the United States for the periods 2004 through 2009. Audit outcomes and the timing of audit settlements are subject to significant uncertainty. It is reasonably possible that within the next twelve months the Company will resolve some or all of the matters presently under consideration for 2004 through 2009 with the IRS and that there could be significant increases or decreases to unrecognized tax benefits. See Note 14 to the Financial Statements for income tax amounts, including reserves.
New Accounting Pronouncements
In May 2011, the Financial Accounting Standards Board (“FASB”) issued guidance amending certain fair value measurement and disclosure requirements in U.S. GAAP and IFRS. The amendments change the wording used to describe many of the requirements in U.S. GAAP for measuring fair value and for disclosing information about fair value measurements. The amendments are intended to create comparability of fair value measurements presented and disclosed in financial statements prepared in accordance with U.S. Generally Accepted Accounting Principles and International Financial Reporting Standards. This guidance is effective for interim and annual periods beginning after December 15, 2011. The Company does not expect material financial statement implications relating to the adoption of this guidance.
In June 2011, the FASB issued guidance amending the presentation of comprehensive income. This amends existing guidance by allowing only two options for presenting the components of net income and other comprehensive income: (1) in a single continuous financial statement, statement of comprehensive income or (2) in two separate but consecutive financial statements, consisting of an income statement followed by a separate statement of other comprehensive income. Also, items that are reclassified from other comprehensive income to net income must be presented on the face of the financial statements. The guidance requires retrospective application, and it is effective for fiscal years, and interim periods within those years, beginning after December 15, 2011. We believe the adoption of this update will change the order in which certain financial statements are presented and provide additional detail on those financial statements when applicable, but will not have any other material impact on our consolidated financial statements. In December 2011, the FASB issued another amendment to defer certain requirements from the June 2011 guidance that relate to the presentation of reclassification adjustments. The amendments will allow the FASB time to redeliberate whether to present on the face of the financial statements the effects of reclassifications out of accumulated other comprehensive income on the components of net income and other comprehensive income for all periods presented. We are in the process of evaluating the disclosure impact of this guidance.
In September 2011, the FASB amended the guidance on the annual testing of goodwill for impairment. The amended guidance will allow companies to assess qualitative factors to determine if it is more-likely-than-not that goodwill might be impaired and whether it is necessary to perform the two-step goodwill impairment test required under current accounting standards. This guidance will be effective for the Company’s fiscal year ending December 30, 2012, with early adoption permitted. The Company has determined that this new guidance will not have a material impact on its consolidated financial statements.
Off Balance Sheet Arrangements
The Company does not engage in any off balance sheet financing arrangements. In particular, the Company does not have any material interest in variable interest entities, which include special purpose entities and structured finance entities.
The Company uses the equity method of accounting to account for its investment in WhiteOak. The Company does not have a majority ownership in or exercise control over the entity. This investment was not material to the financial statements of the Company at December 31, 2011.
30
Seasonality
The Company generally has experienced increased sales during the second quarter of the year, largely as a result of the order patterns of our customers. As a result, the Company’s second quarter net sales, income from operations and net income historically are the highest of any quarter during the year. However, due to the economic conditions of the past two years, this pattern was not evident in 2010 and 2009.
Inflation
The impact of inflation on the Company’s operating results has been moderate in recent years, reflecting generally lower rates of inflation in the economy. While inflation has not had, and the Company does not expect that it will have, a material impact upon operating results, there is no assurance that the Company’s business will not be affected by inflation in the future.
ITEM 7A. QUANTITATIVE AND QUALITATIVE DISCLOSURES ABOUT MARKET RISK
The Company is exposed to market risk from changes in interest rates on borrowed funds, which could affect its results of operations and financial condition. The Company’s interest rate on its debt financing remains variable based upon the Company’s leverage ratio. The Company had no variable-rate debt outstanding at December 31, 2011, and January 1, 2011.
The Company’s exposure to foreign currency exchange fluctuations relates primarily to the direct investment in its facilities in the United Kingdom, Germany, and Korea. The Company does not use financial instruments to hedge foreign currency exchange rate changes.
31
ITEM 8. FINANCIAL STATEMENTS AND SUPPLEMENTARY DATA
| Index to financial statements: | ||||
| 33 | ||||
| 35 | ||||
| Consolidated Balance Sheets as of December 31, 2011 and January 1, 2011 |
36 | |||
| 37 | ||||
| 38 | ||||
| 39 | ||||
| 40 | ||||
32
Report of Independent Registered Public Accounting Firm
To the Board of Directors and
Stockholders of Sun Hydraulics Corporation
We have audited the accompanying consolidated balance sheets of Sun Hydraulics Corporation (a Florida corporation) and subsidiaries (collectively, the Company) as of December 31, 2011 and January 1, 2011, and the related consolidated statements of operations, stockholders’ equity and comprehensive income, and cash flows for each of the years in the two year period ended December 31, 2011. We also have audited Sun Hydraulics Corporation and subsidiaries’ internal control over financial reporting as of December 31, 2011, based on criteria established in Internal Control - Integrated Framework issued by the Committee of Sponsoring Organizations of the Treadway Commission (COSO). The Company’s management is responsible for these consolidated financial statements, for maintaining effective internal control over financial reporting, and for its assessment of the effectiveness of internal control over financial reporting, included in the accompanying Management’s Report on Internal Control over Financial Reporting. Our responsibility is to express an opinion on these consolidated financial statements and an opinion on the company’s internal control over financial reporting based on our audits.
We conducted our audits in accordance with the standards of the Public Company Accounting Oversight Board (United States). Those standards require that we plan and perform the audits to obtain reasonable assurance about whether the consolidated financial statements are free of material misstatement and whether effective internal control over financial reporting was maintained in all material respects. Our audits of the consolidated financial statements included examining, on a test basis, evidence supporting the amounts and disclosures of the consolidated financial statements, assessing the accounting principles used and significant estimates made by management, and evaluating the overall consolidated financial statement presentation. Our audit of internal control over financial reporting included obtaining an understanding of internal control over financial reporting, assessing the risk that a material weakness exists, and testing and evaluating the design and operating effectiveness of internal control based on the assessed risk. Our audits also included performing such other procedures as we considered necessary in the circumstances. The Company’s management has not conducted an assessment of internal control over financial reporting for High Country Tek (“HCT”), which was acquired in September 2011. As such, our audit of internal control over financial reporting did not include this acquisition. We believe that our audits provide a reasonable basis for our opinions.
A company’s internal control over financial reporting is a process designed to provide reasonable assurance regarding the reliability of financial reporting and the preparation of consolidated financial statements for external purposes in accordance with generally accepted accounting principles. A company’s internal control over financial reporting includes those policies and procedures that (1) pertain to the maintenance of records that, in reasonable detail, accurately and fairly reflect the transactions and dispositions of the assets of the company; (2) provide reasonable assurance that transactions are recorded as necessary to permit preparation of consolidated financial statements in accordance with generally accepted accounting principles, and that receipts and expenditures of the company are being made only in accordance with authorizations of management and directors of the company; and (3) provide reasonable assurance regarding prevention or timely detection of unauthorized acquisition, use, or disposition of the company’s assets that could have a material effect on the consolidated financial statements.
Because of its inherent limitations, internal control over financial reporting may not prevent or detect misstatements. Also, projections of any evaluation of effectiveness to future periods are subject to the risk that controls may become inadequate because of changes in conditions, or that the degree of compliance with the policies or procedures may deteriorate.
In our opinion, the consolidated financial statements referred to above present fairly, in all material respects, the financial position of Sun Hydraulics Corporation and subsidiaries as of December 31, 2011 and January 1, 2011, and the results of its operations and its cash flows for each of the years in the two year period ended December 31, 2011, in conformity with accounting principles generally accepted in the United
33
States of America. Also in our opinion, Sun Hydraulics Corporation and subsidiaries maintained, in all material respects, effective internal control over financial reporting as of December 31, 2011, based on criteria established in Internal Control - Integrated Framework issued by the Committee of Sponsoring Organizations of the Treadway Commission (COSO).
/s/ Mayer Hoffman McCann P.C.
March 12, 2012
Clearwater, Florida
34
Report of Independent Registered Public Accounting Firm
To the Board of Directors and
Stockholders of Sun Hydraulics Corporation
We have audited the accompanying consolidated financial statements of operations, shareholders’ equity and comprehensive income, and cash flows of Sun Hydraulics Corporation (a Florida Corporation) and subsidiaries for the year ended January 2, 2010. The Company’s management is responsible for these consolidated financial statements. Our responsibility is to express an opinion on these consolidated financial statements based on our audit.
We conducted our audit in accordance with the standards of the Public Company Accounting Oversight Board (United States). Those standards require that we plan and perform the audits to obtain reasonable assurance about whether the consolidated financial statements are free of material misstatement. An audit also includes examining, on a test basis, evidence supporting the amounts and disclosures in the consolidated financial statements, assessing the accounting principles used and significant estimates made by management, as well as evaluating the overall consolidated financial statement presentation. We believe that our audit provides a reasonable basis for our opinion.
In our opinion, the consolidated financial statements of operations, stockholders’ equity and comprehensive income, and cash flows referred to above present fairly, in all material respects, the results of operations of Sun Hydraulics Corporation and subsidiaries for the year ended January 2, 2010 in conformity with accounting principles generally accepted in the United States of America.
/s/ Kirkland, Russ, Murphy, & Tapp, P.A.
March 12, 2010
Clearwater, Florida
35
Consolidated Balance Sheets
(in thousands, except for share information)
| December 31, 2011 | January 1, 2011 | |||||||
| Assets |
||||||||
| Current assets: |
||||||||
| Cash and cash equivalents |
$ | 51,262 | $ | 33,206 | ||||
| Restricted cash |
46 | 131 | ||||||
| Accounts receivable, net of allowance for doubtful accounts of $83 and $82 |
16,227 | 16,399 | ||||||
| Inventories |
12,829 | 10,773 | ||||||
| Income taxes receivable |
120 | 1,154 | ||||||
| Deferred income taxes |
260 | 446 | ||||||
| Marketable securities |
21,832 | 11,614 | ||||||
| Other current assets |
1,354 | 2,556 | ||||||
|
|
|
|
|
|||||
| Total current assets |
103,930 | 76,279 | ||||||
| Property, plant and equipment, net |
56,959 | 53,127 | ||||||
| Other assets |
6,639 | 2,628 | ||||||
|
|
|
|
|
|||||
| Total assets |
$ | 167,528 | $ | 132,034 | ||||
|
|
|
|
|
|||||
| Liabilities and shareholders’ equity |
||||||||
| Current liabilities: |
||||||||
| Accounts payable |
$ | 4,402 | $ | 3,348 | ||||
| Accrued expenses and other liabilities |
7,466 | 5,250 | ||||||
| Dividends payable |
2,318 | 1,531 | ||||||
|
|
|
|
|
|||||
| Total current liabilities |
14,186 | 10,129 | ||||||
| Deferred income taxes |
6,917 | 5,684 | ||||||
| Other noncurrent liabilities |
1,149 | 1,197 | ||||||
|
|
|
|
|
|||||
| Total liabilities |
22,252 | 17,010 | ||||||
| Commitments and contingencies (Note 19) |
— | — | ||||||
| Shareholders’ equity: |
||||||||
| Preferred stock, 2,000,000 shares authorized, par value $0.001, no shares outstanding |
— | — | ||||||
| Common stock, 40,000,000 shares authorized, par value $0.001, 25,756,442 and 25,522,568 shares outstanding |
26 | 26 | ||||||
| Capital in excess of par value |
48,944 | 44,001 | ||||||
| Retained earnings |
98,426 | 71,132 | ||||||
| Accumulated other comprehensive income (loss) |
(2,120 | ) | (135 | ) | ||||
|
|
|
|
|
|||||
| Total shareholders’ equity |
145,276 | 115,024 | ||||||
|
|
|
|
|
|||||
| Total liabilities and shareholders’ equity |
$ | 167,528 | $ | 132,034 | ||||
|
|
|
|
|
|||||
The accompanying Notes to the Consolidated Financial Statements are an integral part of these financial statements.
36
Consolidated Statements of Operations
(in thousands, except per share data)
| For the year ended | ||||||||||||
| December 31, 2011 | January 1, 2011 | January 2, 2010 | ||||||||||
| Net sales |
$ | 204,171 | $ | 150,695 | $ | 97,393 | ||||||
| Cost of sales |
124,956 | 98,352 | 75,436 | |||||||||
|
|
|
|
|
|
|
|||||||
| Gross profit |
79,215 | 52,343 | 21,957 | |||||||||
| Selling, engineering and administrative expenses |
23,946 | 21,304 | 19,814 | |||||||||
|
|
|
|
|
|
|
|||||||
| Operating income |
55,269 | 31,039 | 2,143 | |||||||||
| Interest income, net |
(775 | ) | (653 | ) | (562 | ) | ||||||
| Foreign currency transaction (gain) loss, net |
(161 | ) | 106 | 265 | ||||||||
| Miscellaneous (income) expense, net |
(1,381 | ) | (57 | ) | 423 | |||||||
|
|
|
|
|
|
|
|||||||
| Income before income taxes |
57,586 | 31,643 | 2,017 | |||||||||
| Income tax provision |
19,909 | 10,243 | 161 | |||||||||
|
|
|
|
|
|
|
|||||||
| Net income |
$ | 37,677 | $ | 21,400 | $ | 1,856 | ||||||
|
|
|
|
|
|
|
|||||||
| Basic net income per common share |
$ | 1.47 | $ | 0.84 | $ | 0.07 | ||||||
| Weighted average basic shares outstanding |
25,642 | 25,428 | 25,256 | |||||||||
| Diluted net income per common share |
$ | 1.47 | $ | 0.84 | $ | 0.07 | ||||||
| Weighted average diluted shares outstanding |
25,684 | 25,478 | 25,305 | |||||||||
| Dividends declared per share |
$ | 0.403 | $ | 0.573 | $ | 0.300 | ||||||
The accompanying Notes to the Consolidated Financial Statements are an integral part of these financial statements.
37
Consolidated Statement of Shareholders’ Equity and Comprehensive Income
(in thousands)
| Preferred Shares |
Preferred Stock |
Common Shares |
Common stock |
Capital in excess of par value |
Retained earnings |
Accumulated other comprehensive income (loss) |
Total | |||||||||||||||||||||||||
| Balance, December 27, 2008 |
— | $ | — | 24,986 | $ | 26 | $ | 38,042 | $ | 70,090 | $ | (1,602 | ) | $ | 106,556 | |||||||||||||||||
|
|
|
|
|
|
|
|
|
|
|
|
|
|
|
|
|
|||||||||||||||||
| Shares issued, Restricted Stock |
60 | — | ||||||||||||||||||||||||||||||
| Shares issued, Other Comp |
6 | — | ||||||||||||||||||||||||||||||
| Shares issued, Stock Options |
5 | 11 | 11 | |||||||||||||||||||||||||||||
| Shares issued, ESPP |
43 | 392 | 392 | |||||||||||||||||||||||||||||
| Shares issued, ESOP |
299 | 2,796 | 2,796 | |||||||||||||||||||||||||||||
| Stock-based compensation |
960 | 960 | ||||||||||||||||||||||||||||||
| Tax benefit of stock-based compensation |
9 | 9 | ||||||||||||||||||||||||||||||
| Dividends issued |
(7,572 | ) | (7,572 | ) | ||||||||||||||||||||||||||||
| Comprehensive income (loss): |
||||||||||||||||||||||||||||||||
| Net income |
1,856 | 1,856 | ||||||||||||||||||||||||||||||
| Unrealized gain on available for sale securities |
116 | 116 | ||||||||||||||||||||||||||||||
| Foreign currency translation adjustments |
2,490 | 2,490 | ||||||||||||||||||||||||||||||
|
|
|
|||||||||||||||||||||||||||||||
| Comprehensive income (loss): |
4,462 | |||||||||||||||||||||||||||||||
|
|
|
|
|
|
|
|
|
|
|
|
|
|
|
|
|
|||||||||||||||||
| Balance, January 2, 2010 |
— | $ | — | 25,399 | $ | 26 | $ | 42,210 | $ | 64,374 | $ | 1,004 | $ | 107,614 | ||||||||||||||||||
|
|
|
|
|
|
|
|
|
|
|
|
|
|
|
|
|
|||||||||||||||||
| Shares issued, Restricted Stock |
69 | — | ||||||||||||||||||||||||||||||
| Shares issued, Other Comp |
8 | — | ||||||||||||||||||||||||||||||
| Shares issued, Stock Options |
15 | 44 | 44 | |||||||||||||||||||||||||||||
| Shares issued, ESPP |
32 | 423 | 423 | |||||||||||||||||||||||||||||
| Stock-based compensation |
1,149 | 1,149 | ||||||||||||||||||||||||||||||
| Tax benefit of stock-based compensation |
175 | 175 | ||||||||||||||||||||||||||||||
| Dividends issued |
(14,642 | ) | (14,642 | ) | ||||||||||||||||||||||||||||
| Comprehensive income (loss): |
— | |||||||||||||||||||||||||||||||
| Net income |
21,400 | 21,400 | ||||||||||||||||||||||||||||||
| Unrealized gain on available for sale securities |
(59 | ) | (59 | ) | ||||||||||||||||||||||||||||
| Foreign currency translation adjustments |
(1,080 | ) | (1,080 | ) | ||||||||||||||||||||||||||||
|
|
|
|||||||||||||||||||||||||||||||
| Comprehensive income (loss): |
20,261 | |||||||||||||||||||||||||||||||
|
|
|
|
|
|
|
|
|
|
|
|
|
|
|
|
|
|||||||||||||||||
| Balance, January 1, 2011 |
— | $ | — | 25,523 | $ | 26 | $ | 44,001 | $ | 71,132 | $ | (135 | ) | $ | 115,024 | |||||||||||||||||
|
|
|
|
|
|
|
|
|
|
|
|
|
|
|
|
|
|||||||||||||||||
| Shares issued, Restricted Stock |
88 | — | ||||||||||||||||||||||||||||||
| Shares issued, Other Comp |
14 | — | ||||||||||||||||||||||||||||||
| Shares issued, Stock Options |
9 | 61 | 61 | |||||||||||||||||||||||||||||
| Shares issued, ESPP |
29 | 574 | 574 | |||||||||||||||||||||||||||||
| Shares issued, shared distribution |
93 | 2,412 | 2,412 | |||||||||||||||||||||||||||||
| Stock-based compensation |
1,752 | 1,752 | ||||||||||||||||||||||||||||||
| Tax benefit of stock-based compensation |
144 | 144 | ||||||||||||||||||||||||||||||
| Dividends issued |
(10,383 | ) | (10,383 | ) | ||||||||||||||||||||||||||||
| Comprehensive income (loss): |
||||||||||||||||||||||||||||||||
| Net income |
37,677 | 37,677 | ||||||||||||||||||||||||||||||
| Unrealized loss on available for sale securities |
(549 | ) | (549 | ) | ||||||||||||||||||||||||||||
| Foreign currency translation adjustments |
(1,436 | ) | (1,436 | ) | ||||||||||||||||||||||||||||
|
|
|
|||||||||||||||||||||||||||||||
| Comprehensive income (loss): |
35,692 | |||||||||||||||||||||||||||||||
|
|
|
|
|
|
|
|
|
|
|
|
|
|
|
|
|
|||||||||||||||||
| Balance, December 31, 2011 |
— | $ | — | 25,756 | $ | 26 | $ | 48,944 | $ | 98,426 | $ | (2,120 | ) | $ | 145,276 | |||||||||||||||||
|
|
|
|
|
|
|
|
|
|
|
|
|
|
|
|
|
|||||||||||||||||
The accompanying Notes to the Consolidated Financial Statements are an integral part of these financial statements.
38
Consolidated Statements of Cash Flows
(in thousands)
| For the year ended | ||||||||||||
| December 31, 2011 | January 1, 2011 | January 2, 2010 | ||||||||||
| Cash flows from operating activities: |
||||||||||||
| Net income |
$ | 37,677 | $ | 21,400 | $ | 1,856 | ||||||
| Adjustments to reconcile net income to net cash provided by operating activities: |
||||||||||||
| Depreciation and amortization |
6,721 | 6,873 | 6,968 | |||||||||
| (Gain) loss on disposal of assets |
(32 | ) | (43 | ) | 30 | |||||||
| Gain on Investment in HCT |
(1,244 | ) | — | — | ||||||||
| Stock-based compensation expense |
1,752 | 1,149 | 960 | |||||||||
| Deferred director and phantom stock unit expense (income) |
(22 | ) | 557 | 398 | ||||||||
| Stock compensation income tax benefit |
(144 | ) | (175 | ) | (9 | ) | ||||||
| Allowance for doubtful accounts |
1 | (8 | ) | (2 | ) | |||||||
| Provision for slow moving inventory |
(19 | ) | (159 | ) | (41 | ) | ||||||
| Provision for deferred income taxes |
1,419 | 622 | 4 | |||||||||
| (Increase) decrease in: |
||||||||||||
| Accounts receivable |
741 | (6,442 | ) | 2,555 | ||||||||
| Inventories |
(1,593 | ) | (2,815 | ) | 2,202 | |||||||
| Income tax receivable |
1,178 | 506 | (123 | ) | ||||||||
| Other current assets |
(662 | ) | (759 | ) | (507 | ) | ||||||
| Other assets, net |
(1,081 | ) | 750 | 560 | ||||||||
| Increase (decrease) in: |
||||||||||||
| Accounts payable |
499 | 861 | (816 | ) | ||||||||
| Accrued expenses and other liabilities |
4,390 | 2,775 | (672 | ) | ||||||||
| Other noncurrent liabilities |
(37 | ) | (2 | ) | 304 | |||||||
|
|
|
|
|
|
|
|||||||
| Net cash from operating activities |
49,544 | 25,090 | 13,667 | |||||||||
| Cash flows from investing activities: |
||||||||||||
| Sale of China joint venture |
1,451 | — | — | |||||||||
| Investment in HCT |
(1,776 | ) | — | — | ||||||||
| Capital expenditures |
(10,143 | ) | (3,856 | ) | (5,096 | ) | ||||||
| Proceeds from dispositions of equipment |
35 | 175 | — | |||||||||
| Purchases of marketable securities |
(18,405 | ) | (14,175 | ) | (10,600 | ) | ||||||
| Proceeds from sale of marketable securities |
7,517 | 10,230 | 2,863 | |||||||||
|
|
|
|
|
|
|
|||||||
| Net cash used in investing activities |
(21,321 | ) | (7,626 | ) | (12,833 | ) | ||||||
| Cash flows from financing activities: |
||||||||||||
| Repayment of debt |
(100 | ) | — | (261 | ) | |||||||
| Proceeds from exercise of stock options |
61 | 44 | 11 | |||||||||
| Stock compensation income tax benefit |
144 | 175 | 9 | |||||||||
| Proceeds from stock issued |
574 | 423 | 392 | |||||||||
| Dividends to shareholders |
(9,596 | ) | (14,635 | ) | (7,547 | ) | ||||||
|
|
|
|
|
|
|
|||||||
| Net cash used in financing activities |
(8,917 | ) | (13,993 | ) | (7,396 | ) | ||||||
| Effect of exchange rate changes on cash and cash equivalents |
(1,335 | ) | (580 | ) | 1,705 | |||||||
|
|
|
|
|
|
|
|||||||
| Net increase (decrease) in restricted cash |
(85 | ) | (1 | ) | 5 | |||||||
| Net increase (decrease) in cash and cash equivalents |
18,056 | 2,892 | (4,862 | ) | ||||||||
|
|
|
|
|
|
|
|||||||
| Cash and cash equivalents and restricted cash, beginning of period |
33,337 | 30,446 | 35,303 | |||||||||
|
|
|
|
|
|
|
|||||||
| Cash and cash equivalents and restricted cash, end of period |
$ | 51,308 | $ | 33,337 | $ | 30,446 | ||||||
|
|
|
|
|
|
|
|||||||
| Supplemental disclosure of cash flow information: |
||||||||||||
| Cash paid: |
||||||||||||
| Interest |
$ | — | $ | — | $ | 9 | ||||||
| Income taxes |
$ | 17,456 | $ | 9,290 | $ | 289 | ||||||
| Supplemental disclosure of noncash transactions: |
||||||||||||
| Common stock issued to ESOP through accrued expenses and other liabilities |
$ | 2,412 | $ | — | $ | 2,796 | ||||||
| Unrealized gain (loss) on available for sale securities |
$ | (549 | ) | $ | (59 | ) | $ | 116 | ||||
The accompanying Notes to the Consolidated Financial Statements are an integral part of these financial statements.
39
SUN HYDRAULICS CORPORATION NOTES TO THE CONSOLIDATED FINANCIAL STATEMENTS
(in thousands, except per share data)
| 1. | BUSINESS |
Sun Hydraulics Corporation, and its wholly-owned subsidiaries and joint ventures, design, manufacture, and sell screw-in cartridge valves and manifolds used in hydraulic systems. The Company has facilities in the United States, the United Kingdom, Germany, Korea, France, and China. Sun Hydraulics Corporation (“Sun Hydraulics”), with its main offices located in Sarasota, Florida, designs, manufactures, and sells primarily through distributors. Sun Hydraulik Holdings Limited (“Sun Holdings”), a wholly-owned subsidiary of Sun Hydraulics, was formed to provide a holding company for the European market operations; its wholly-owned subsidiaries are Sun Hydraulics Limited (a British corporation, “Sun Ltd.”) and Sun Hydraulik GmbH (a German corporation, “Sun GmbH”). Sun Ltd. operates a manufacturing and distribution facility located in Coventry, England, and Sun GmbH operates a manufacturing and distribution facility located in Erkelenz, Germany. Sun Hydraulics Korea Corporation (“Sun Korea”), a wholly-owned subsidiary of Sun Hydraulics, located in Inchon, South Korea, operates a manufacturing and distribution facility. Sun Hydraulics, SARL (“Sun France”), a wholly-owned subsidiary of Sun Hydraulics, located in Bordeaux, France, was dissolved in November 2011. Concurrently, Sun Hydraulics opened a liaison office in France to service this market. Sun Hydraulics established Sun Hydraulics China Co. Ltd, a representative office in Shanghai in January 2011, to develop new business opportunities in the Chinese market. Sun Hydraulics (India) a liaison office in Bangalore, India is used to develop new business opportunities in the Indian market. WhiteOak Controls, Inc. (“WhiteOak”), a 40% equity method investment, located in Mediapolis, Iowa, designs and produces complementary electronic control products. On September 27, 2011, Sun Hydraulics purchased the outstanding shares of High Country Tek, Inc. (“HCT”) it did not already own. HCT is located in Nevada City, California, and designs and manufacturers ruggedized electronic/hydraulic control solutions for mobile equipment markets (see Note 9).
| 2. | SUMMARY OF SIGNIFICANT ACCOUNTING POLICIES |
Principles of Consolidation
The consolidated financial statements include the accounts and operations of Sun Hydraulics and its direct and indirect subsidiaries. All significant intercompany accounts and transactions are eliminated in consolidation. The Company uses the equity method of accounting for its investment in WhiteOak. The Company does not have a majority ownership in or exercise control over this entity.
Critical Accounting Policies and Use of Estimates
The preparation of financial statements in conformity with accounting principles generally accepted in the United States of America requires management to make estimates and assumptions that affect the reported amounts of assets and liabilities and disclosure of contingent assets and liabilities at the date of the financial statements and the reported amounts of revenues and expenses during the reporting period. Actual results could differ from those estimates. Significant estimates are used in the determination of impairment of long-lived assets, inventory, goodwill, accruals, and income taxes.
Cash and Cash Equivalents
The Company considers all short-term highly liquid investments purchased with an original maturity of three months or less to be cash equivalents.
Accounts Receivable
The Company sells to most of its customers on a recurring basis, primarily through distributors with which the Company maintains long-term relationships. As a result, bad debt experience has not been material. The allowance for doubtful accounts is determined on a specific identification basis by a review of those accounts that are significantly in arrears. There can be no assurance that a distributor or a large direct sale customer with overdue accounts receivable balances will not develop financial difficulties and default on payment. See the consolidated balance sheets for allowance amounts.
Inventory
Inventories are valued at the lower of cost or market, with cost determined on a first-in, first-out basis. The Company offers a wide variety of standard products and as a matter of policy does not discontinue products. On an ongoing basis, component parts found to be obsolete through design or process changes
40
are disposed of and charged to material cost. The Company reviews on-hand balances of products and component parts against specific criteria. Products and component parts without usage or that have excess quantities on hand are evaluated. An inventory reserve is then established for the full inventory carrying value of those products and component parts deemed to be obsolete or slow moving. See Note 5 to the Financial Statements for inventory reserve amounts.
Property, Plant and Equipment
Property, plant and equipment is stated at cost. Expenditures for repairs and improvements that significantly add to the productive capacity or extend the useful life of an asset are capitalized. Repairs and maintenance are expensed as incurred. Depreciation is computed using the straight line method over the following useful lives:
| Years | ||
| Computer equipment |
3 -5 | |
| Machinery and equipment |
4 - 12 | |
| Furniture and fixtures |
4 - 10 | |
| Leasehold and land improvements |
5 - 15 | |
| Buildings |
40 |
Gains or losses on the retirement, sale, or disposition of property, plant, and equipment are reflected in the Consolidated Statement of Operations in the period in which the assets are taken out of service.
Goodwill
Goodwill, which represents the excess of the purchase price of acquisition over the fair value of the net assets acquired and other acquisition costs, is carried at cost. Goodwill is not amortized by the Company. Instead, goodwill is reviewed for impairment on an annual basis, or more frequently if events or circumstances indicate possible impairment.
The Company acquired its Korean operations in September 1998 using the purchase method. As a result, goodwill is reflected on the consolidated balance sheet. A valuation using a discounted cash flow method was performed at December 31, 2011 and January 1, 2011. It was determined that the value of the goodwill was not impaired. Goodwill arising from the acquisition of HCT on September 27, 2011, consisting of the value of the workforce, synergies and competitive advantages obtained as a result of the acquisition is reflected on the consolidated balance sheet. There have been no events or changes in circumstances that would indicate impairment since the valuation of HCT at the time of purchase. There is no assurance that the value of the acquired company will not decrease in the future due to changing business conditions. See Note 7 to the Financial Statements for goodwill amounts.
Impairment of Long-Lived Assets
Long-lived assets, such as property and equipment, and purchased intangibles subject to amortization, are reviewed for impairment whenever events or changes in circumstances indicate that the carrying amount of an asset may not be recoverable. Recoverability of the asset is measured by comparison of its carrying amount to future net cash flows the asset is expected to generate. If such assets are considered impaired, the impairment to be recognized is measured as the amount by which the carrying amount of the asset exceeds its fair market value.
Accruals
The Company makes estimates related to certain employee benefits and miscellaneous accruals. Estimates for employee benefit accruals are based on management’s assessment of estimated liabilities related to workers’ compensation, health care benefits and annual contributions to an employee stock ownership plan (“ESOP”), established in 2004 as part of the Company’s retirement plan. Estimates for miscellaneous accruals are based on management’s assessment of estimated liabilities for costs incurred.
The Company accrues for health care benefit costs under a self-funded plan. The Company purchases re-insurance for both specific and aggregate stop losses on claims that exceed $115 on an individual basis and approximately $7,600 on an aggregate basis.
41
Revenue Recognition
The Company reports revenues, net of sales incentives, when title passes and risk of loss transfers to the customer. The effect of material non-recurring events is provided for when they become known. The Company has not experienced any material product liabilities in the past.
Shipping and Handling Costs
Shipping and handling costs billed to distributors and customers are recorded in revenue. Shipping costs incurred by the Company are recorded in cost of goods sold.
Foreign Currency Translation and Transactions
The Pound Sterling is the functional currency of Sun Ltd. The Euro is the functional currency of Sun GmbH. The South Korean Won is the functional currency of Sun Korea. The U.S. Dollar is the functional currency for Sun Hydraulics and the reporting currency for the consolidated group. The assets and liabilities of Sun Ltd., Sun GmbH, and Sun Korea are translated at the exchange rate in effect at the balance sheet date, and income and expense items are translated at the average annual rate of exchange for the period. The resulting unrealized translation gains and losses are included as a component of shareholders’ equity designated as “accumulated other comprehensive income (loss).” Realized gains and losses from foreign currency transactions are included in the Consolidated Statement of Operations.
Income Taxes
The Company’s income tax policy provides for a liability approach under which deferred income taxes are provided for based upon enacted tax laws and rates applicable to the periods in which the taxes become payable. These differences result from items reported differently for financial reporting and income tax purposes, primarily depreciation, accrued expenses and reserves.
The Company reports a liability for unrecognized tax benefits resulting from uncertain tax positions taken or expected to be taken in a tax return. The Company recognizes potential interest and penalties related to its unrecognized tax benefits in income tax expense.
Stock-Based Compensation
All share-based compensation cost is measured at the grant date, based on the fair value of the award, and is recognized as an expense in earnings over the requisite service period. Benefits of tax deductions in excess of recognized compensation costs are reported as a financing cash inflow.
52-53 Week Fiscal Year
The Company reports on a fiscal year that ends on the Saturday closest to December 31st. Each quarter generally consists of thirteen weeks. As a result of the 2009 fiscal year ending January 2, 2010, the quarter ended January 2, 2010, consisted of fourteen weeks, resulting in a 53-week year.
Reclassification
Certain amounts shown in the 2010 and 2009 notes to the consolidated financial statements have been reclassified to conform to the current presentation.
| 3. | FAIR VALUE OF FINANCIAL INSTRUMENTS |
The Company uses the three-tier fair value hierarchy which prioritizes the inputs used in measuring fair value as follows:
Level 1. Observable inputs such as quoted prices in active markets;
Level 2. Inputs, other than the quoted prices in active markets, that are observable either directly or indirectly; and
Level 3. Unobservable inputs in which there is little or no market data, which require the reporting entity to develop its own assumptions.
At December 31, 2011, and January 1, 2011, the Company held available-for-sale securities with an aggregate fair value of $21,832 and $11,614, respectively. The Company, on a recurring basis, measures available-for-sale securities at fair value using quoted prices in active markets. Unrealized gains and losses
42
arising from the revaluation of available-for-sale securities are included in equity within accumulated other comprehensive income (loss) in the Consolidated Balance Sheets. Realized gains and losses on sales of marketable securities are generally determined using the specific identification method, and are included in miscellaneous (income) expense in the Consolidated Statements of Operations. The net unrealized holding loss on available for sale securities amounted to $492 at December 31, 2011, and $59 at January 1, 2011. Realized gains for the year ended December 31, 2011 were $37, compared to $70 for the year ended January 1, 2011. In addition, the Company reports deferred director stock units and phantom stock units as a liability. These liabilities, on a recurring basis, are measured at fair value using quoted prices in the active market. The Company recognized income relating to those liabilities of $22 for the year ended December 31, 2011, and an expense related to those liabilities of $557 for the year ended January 1, 2011, respectively.
The Company did not have any fair value adjustments for assets and liabilities measured at fair value on a nonrecurring basis during the period ended December 31, 2011 and January 1, 2011.
Assets measured at fair value on a recurring basis include the following as of December 31, 2011:
| Fair Value Measurements at Reporting Date Using | ||||||||||||||||
| Description | December 31, 2011 | Quoted Prices in Active Markets (Level 1) |
Significant Other (Level 2) |
Significant (Level 3) |
||||||||||||
| Available-for-sale securities |
$ | 21,832 | $ | 21,832 | $ | — | $ | — | ||||||||
|
|
|
|
|
|
|
|
|
|||||||||
Assets measured at fair value on a recurring basis include the following as of January 1, 2011:
| Fair Value Measurements at Reporting Date Using | ||||||||||||||||
| Description | January 1, 2011 | Quoted Prices in Active Markets (Level 1) |
Significant Other (Level 2) |
Significant (Level 3) |
||||||||||||
| Available-for-sale securities |
$ | 11,614 | $ | 11,614 | $ | — | $ | — | ||||||||
|
|
|
|
|
|
|
|
|
|||||||||
Liabilities measured at fair value on a recurring basis include the following as of December 31, 2011:
| Fair Value Measurements at Reporting Date Using | ||||||||||||||||
| Description | December 31, 2011 | Quoted Prices in Active Markets (Level 1) |
Significant Other (Level 2) |
Significant (Level 3) |
||||||||||||
| Deferred director stock units |
$ | 1,149 | $ | 1,149 | $ | — | $ | — | ||||||||
| Phantom stock units |
33 | 33 | — | — | ||||||||||||
|
|
|
|
|
|
|
|
|
|||||||||
| Total |
$ | 1,182 | $ | 1,182 | $ | — | $ | — | ||||||||
|
|
|
|
|
|
|
|
|
|||||||||
43
Liabilities measured at fair value on a recurring basis include the following as of January 1, 2011:
| Fair Value Measurements at Reporting Date Using | ||||||||||||||||
| Description | January 1, 2011 | Quoted Prices in Active Markets (Level 1) |
Significant Other (Level 2) |
Significant (Level 3) |
||||||||||||
| Deferred director stock units |
$ | 1,197 | $ | 1,197 | $ | — | $ | — | ||||||||
| Phantom stock units |
34 | 34 | — | — | ||||||||||||
|
|
|
|
|
|
|
|
|
|||||||||
| Total |
$ | 1,231 | $ | 1,231 | $ | — | $ | — | ||||||||
|
|
|
|
|
|
|
|
|
|||||||||
The carrying amounts of cash and cash equivalents, restricted cash, accounts receivable, other current assets, accounts payable, accrued expenses and other liabilities approximate fair value based on their short-term status.
| 4. | RESTRICTED CASH |
On December 31, 2011 and January 1, 2011, the Company had restricted cash of $46 and $131, respectively. $46 and $47 of the 2011 and 2010 restricted cash balance, respectively, consisted of reserves for customs and excise taxes in the U.K. operation. The restricted amount was calculated as an estimate of two months of customs and excise taxes for items coming into the Company’s U.K. operations and was held with Lloyd’s TSB in the U.K. The remaining 2010 amount relates to a guarantee of VAT in our France operation. The guarantee was held with Crédit Agricole Bank in France.
| 5. | INVENTORIES |
| December 31, 2011 | January 1, 2011 | |||||||
| Raw materials |
$ | 5,624 | $ | 4,315 | ||||
| Work in process |
3,912 | 3,628 | ||||||
| Finished goods |
3,861 | 3,379 | ||||||
| Provision for slow moving inventory |
(568 | ) | (549 | ) | ||||
|
|
|
|
|
|||||
| Total |
$ | 12,829 | $ | 10,773 | ||||
|
|
|
|
|
|||||
| 6. | PROPERTY, PLANT, AND EQUIPMENT |
| December 31, 2011 | January 1, 2011 | |||||||
| Machinery and equipment |
$ | 78,428 | $ | 75,728 | ||||
| Office furniture and equipment |
10,151 | 9,047 | ||||||
| Buildings |
28,074 | 25,257 | ||||||
| Leasehold and land improvements |
2,774 | 2,754 | ||||||
| Land |
7,002 | 7,022 | ||||||
|
|
|
|
|
|||||
| $ | 126,429 | $ | 119,808 | |||||
| Less: Accumulated depreciation |
(73,755 | ) | (68,648 | ) | ||||
| Construction in progress |
4,285 | 1,967 | ||||||
|
|
|
|
|
|||||
| Total |
$ | 56,959 | $ | 53,127 | ||||
|
|
|
|
|
|||||
Depreciation expense for the years ended December 31, 2011, January 1, 2011, and January 2, 2010 totaled $6,524, $6,730, and $6,932, respectively.
44
| 7. | GOODWILL AND INTANGIBLE ASSETS |
The Company had $2,691 and $715 of goodwill at December 31, 2011, and January 1, 2011, respectively. Included in both balances is goodwill equal to $715 related to its acquisition of Sun Korea. The Company recognized goodwill arising from the acquisition of HCT on September 27, 2011, equal to $1,976 consisting of the value of the workforce, synergies and competitive advantages obtained as a result of the acquisition. There have been no events or changes in circumstances that would indicate impairment since the valuation at the time of purchase. Valuation models reflecting the expected future cash flow projections were used to value Sun Korea at December 31, 2011 and January 1, 2011. The analysis indicated that there was no impairment of the carrying value of the goodwill. Goodwill is held in other assets on the balance sheet.
The Company recognized $2,658 in identifiable intangible assets as a result of the acquisition of HCT on September 27, 2011. Intangible assets are held in other assets on the balance sheet. At December 31, 2011, intangible assets consisted of the following:
| Useful life (years) |
Gross carrying amount |
Accumulated amortization |
Net carrying amount |
|||||||||||||
| Definite-lived intangibles: |
||||||||||||||||
| Trade Name |
10 | $ | 756 | $ | (19 | ) | $ | 737 | ||||||||
| Technology |
10 | 697 | (187 | ) | 510 | |||||||||||
| Customer Relationships |
20 | 1,475 | (18 | ) | 1,457 | |||||||||||
|
|
|
|
|
|
|
|||||||||||
| $ | 2,928 | $ | (224 | ) | $ | 2,704 | ||||||||||
Total estimated amortization expense for the years 2012 through 2016 is presented below.
| Year: |
||||
| 2012 |
219 | |||
| 2013 |
219 | |||
| 2014 |
219 | |||
| 2015 |
206 | |||
| 2016 |
192 | |||
|
|
|
|||
| Total |
$ | 1,055 |
| 8. | INVESTMENTS |
On January 5, 2011, Sun Hydraulics completed the sale of its Chinese joint venture company, Sun Hydraulics Systems (Shanghai) Co, Ltd., to the joint venture partner, Links Lin, for the amount of $1,451, and recognized a gain on the sale of $366. The former joint venture company has become Sun’s first authorized distributor in China. Concurrently, Sun established Sun Hydraulics China Co. Ltd, a representative office in Shanghai which now is the Company’s primary operation in the country.
| 9. | ACQUISITIONS |
On November 30, 2007, Sun Hydraulics acquired shares of preferred and common stock of HCT, which represented 48% of the outstanding shares at the time of purchase. On September 27, 2011, Sun purchased the remaining preferred and common shares of HCT. HCT designs and produces encapsulated, modular, highly ruggedized digital and analog electronic controller products for the global fluid power and motion control industry. HCT’s products complement Sun’s electro-hydraulic line of valves providing reliable, easy, simple and accurate control of individual valves, or seamless management of systems and sub-systems.
Goodwill arising from the acquisition was $1,976 consisting of the value of the workforce, synergies and competitive advantages obtained as a result of the acquisition. Identifiable intangible assets arising from the acquisition consist of the HCT Trade Name, Patented Technology, Unpatented Technology, and Customer Relationships. These identifiable intangibles totaled $2,658, and are amortized over ten years with the exception of Customer Relationships, which are amortized over twenty years. These amounts are recorded as other assets on the consolidated balance sheet.
45
The following table summarizes the consideration paid for HCT and the amounts of the assets acquired and liabilities assumed, recognized at the acquisition date.
| At September 27, 2011 |
||||
| Consideration |
||||
| Cash |
$ | 1,894 | ||
| Stock |
12 | |||
|
|
|
|||
| Fair value of total consideration transferred |
$ | 1,906 | ||
| Fair value of Sun’s equity interest in HCT held before the business combination |
1,472 | |||
|
|
|
|||
| Total |
$ | 3,378 | ||
| Acquisition-related costs (included in Selling, engineering, and administrative expenses) |
40 | |||
| Recognized amounts of identifiable assets acquired and liabilities assumed |
||||
| Cash |
$ | 130 | ||
| Accounts receivable |
570 | |||
| Inventory |
444 | |||
| Property, plant, and equipment |
317 | |||
| Identifiable intangible assets |
2,658 | |||
| Other assets |
210 | |||
| Accounts payable and accrued expenses |
(748 | ) | ||
| Notes payable |
(2,123 | ) | ||
| Other liabilities |
(56 | ) | ||
|
|
|
|||
| Total identifiable net assets |
$ | 1,402 | ||
| Goodwill |
1,976 | |||
|
|
|
|||
| Total |
$ | 3,378 | ||
Approximately half of the acquisition related costs above were incurred in the third quarter with the remainder incurred in the Company’s fourth quarter. The amount of notes payable above is primarily made up of amounts due to Sun Hydraulics and eliminate upon consolidation.
Sun Hydraulics’ fair value of the equity interest in HCT held before the business combination was $1,472. The fair value of the previously held equity interest was determined based on the current purchase price per the purchase agreement before the deduction for option and warrant proceeds. Sun Hydraulics recognized a gain of $1,244 as a result of remeasuring to fair value, based on the current purchase price, its 38% equity interest in HCT held before the business combination. The equity interest was diluted from the original investment as a result of warrant and option exercises. This gain is included in net miscellaneous income on the Consolidated Statement of Operations for the year ending December 31, 2011.
For the period ending October 1, 2011, the Company accounted for HCT under the equity method. The revenue and earnings for HCT included in Sun’s Consolidated Statement of Operations for the year ended December 31, 2011, and the revenue and earnings of the combined entity had the acquisition date been January 2, 2011, or January 3, 2010, are:
| Revenue | Earnings | |||||||
| Actual from 10/02/2011 - 12/31/2011 |
$ | 1,270 | $ | (58 | ) | |||
| Revenue (unaudited) |
Earnings (unaudited) |
|||||||
| Supplemental pro forma from |
||||||||
| 1/02/2011 to 12/31/2011 |
$ | 206,968 | $ | 37,534 | ||||
| Supplemental pro forma from |
||||||||
| 1/03/2010 to 01/01/2011 |
$ | 153,742 | $ | 21,075 | ||||
46
| 10. | OTHER ASSETS |
| December 31, 2011 | January 1, 2011 | |||||||
| Goodwill |
$ | 2,691 | $ | 715 | ||||
| Definite-lived intangibles net of amortization of $224 and $148 |
2,704 | 122 | ||||||
| Equity investment in joint venture |
||||||||
| Sun China |
— | 1,016 | ||||||
| WhiteOak Controls, Inc. |
66 | 40 | ||||||
| High Country Tek, Inc. |
— | 495 | ||||||
| Loan acquisition costs, net of amortization of $7 and $151 |
79 | 19 | ||||||
| Deposits with suppliers |
33 | 110 | ||||||
| Notes Receivable |
988 | — | ||||||
| Other |
78 | 111 | ||||||
|
|
|
|
|
|||||
| Total |
$ | 6,639 | $ | 2,628 | ||||
|
|
|
|
|
|||||
| 11. | ACCRUED EXPENSES AND OTHER LIABILITIES |
| December 31, 2011 | January 1, 2011 | |||||||
| Compensation and benefits |
$ | 6,360 | $ | 4,349 | ||||
| Self insurance liability |
256 | 236 | ||||||
| Other |
850 | 665 | ||||||
|
|
|
|
|
|||||
| Total |
$ | 7,466 | $ | 5,250 | ||||
|
|
|
|
|
|||||
| 12. | LONG-TERM DEBT |
Effective August 1, 2011, the company completed a credit and security agreement in the U.S. with Fifth Third Bank (the “Bank”). The new agreement provides for three separate credit facilities totaling $50,000.
Facility A is a $15,000 unsecured revolving line of credit and requires monthly payments of interest. Facility A has a floating interest rate of 1.45% over the 30-day LIBOR Rate (as defined).
Facility B is an accordion feature to increase the revolving line of credit to a $35,000 secured revolving line of credit. Facility B will be secured by the Company’s U.S. assets, including its manufacturing facilities, and requires monthly payments of interest. Facility B will bear interest at the 30-day LIBOR Rate or the Bank’s Base Rate (as defined), at the Company’s discretion, plus a margin based on the Borrower’s Funded Debt to EBITDA Leverage Ratio (as defined). The LIBOR Margin ranges from 1.45% to 2.25% and the Bank’s Base Rate ranges from -0.25% to 0.00%.
47
Facility C is a $15,000 construction and term loan. Facility C requires monthly payments of interest for the first 24 months and monthly payments of principal plus accrued interest for 60 months based upon a 15 year amortization schedule. The Construction Loan bears interest at the 30-day LIBOR Rate or the Bank’s Base Rate, at the Company’s discretion, plus a margin based on the Borrower’s Funded Debt to EBITDA Leverage Ratio. The LIBOR Margin ranges from 1.65% to 2.45% and the Bank’s Base Rate ranges from -0.05% to 0.20%.
Facility A or Facility B (if activated) is payable in full on August 1, 2016. Facility C is payable seven years after the closing of the facility. Maturity may be accelerated by the Bank upon an Event of Default (as defined). Prepayment may be made without penalty or premium at any time upon the required notice to the Bank.
Facility A is subject to debt covenants (capitalized terms are defined therein) including: 1) Minimum Tangible Net Worth of not less than $92,000, increased annually by 50% of Net Income, and 2) Minimum EBITDA of not less than $5,000; and requires the Company to maintain its primary domestic deposit accounts with the bank.
If Facility B or Facility C are activated, covenant 2 above will automatically terminate and two additional covenants will be required: 1) Funded Debt to EBITDA ratio equal to or less than 3.0:1.0, and 2) EBIT to Interest Expense ratio of not less than 2.5:1.0.
As a result of the acquisition of HCT on September 27, 2011, the Company acquired a line of credit equal to $100. Interest on the line of credit is equal to Prime plus 5%. The Company cancelled this line of credit during the fourth quarter of 2011.
| 13. | DIVIDENDS TO SHAREHOLDERS |
The Company declared dividends of $10,383, $14,642, and $7,572 to shareholders in 2011, 2010, and 2009, respectively.
The Company declared the following regular quarterly dividends to shareholders of record on the last day of the respective quarter:
| 2011 | 2010 | 2009 | ||||||||||
| First quarter |
$ | 0.060 | $ | 0.060 | $ | 0.060 | ||||||
| Second quarter |
0.090 | 0.060 | 0.060 | |||||||||
| Third quarter |
0.090 | 0.060 | 0.060 | |||||||||
| Fourth quarter |
0.090 | 0.060 | 0.060 | |||||||||
These dividends were paid on the 15th day of each month following the date of declaration.
In addition to the regular quarterly dividends, the Company declared shared distribution cash dividends in 2011 and 2009, equal to $0.07 and $0.06, respectively. The 2011 dividend was paid on March 31, 2011 to shareholders of record as of March 15, 2011, and the 2009 dividend was paid on March 31, 2009, to shareholders of record as of March 15, 2009.
In 2010, the Company also declared a one-time special cash dividend of $0.33 per share, paid on November 30, 2010, to shareholders of record as of November 15, 2010.
The Board of Directors has declared a shared distribution cash dividend of $0.12 per share, payable on March 31, 2012, to shareholders of record as of March 22, 2012. The shared distribution was introduced in 2008 as a way to reward both shareholders and employees when the Company has a successful year. Additionally, the Company’s board of directors declared a first quarter 2012 cash dividend of $0.09 per share payable on April 15, 2012, to shareholders of record as of March 31, 2012.
48
| 14. | INCOME TAXES |
Deferred income tax assets and liabilities are provided to reflect the future tax consequences of differences between the tax basis of assets and liabilities and their reported amounts in the financial statements.
For financial reporting purposes, income before income taxes includes the following components:
| For the year ended | ||||||||||||
| December 31, | January 1, | January 2, | ||||||||||
| 2011 | 2011 | 2010 | ||||||||||
| United States |
$ | 43,513 | $ | 22,344 | $ | (1,934 | ) | |||||
| Foreign |
14,073 | 9,299 | 3,951 | |||||||||
|
|
|
|
|
|
|
|||||||
| Total |
$ | 57,586 | $ | 31,643 | $ | 2,017 | ||||||
|
|
|
|
|
|
|
|||||||
The components of the income tax provision (benefit) are as follows:
| For the year ended | ||||||||||||
| December 31, | January 1, | January 2, | ||||||||||
| 2011 | 2011 | 2010 | ||||||||||
| Current tax expense (benefit): |
||||||||||||
| United States |
$ | 14,034 | $ | 7,985 | $ | (773 | ) | |||||
| State and local |
436 | 202 | (46 | ) | ||||||||
| Foreign |
3,972 | 1,434 | 976 | |||||||||
|
|
|
|
|
|
|
|||||||
| Total current |
18,442 | 9,621 | 157 | |||||||||
|
|
|
|
|
|
|
|||||||
| Deferred tax expense (benefit): |
||||||||||||
| United States |
1,095 | 469 | 14 | |||||||||
| State and local |
471 | 263 | 6 | |||||||||
| Foreign |
(99 | ) | (110 | ) | (16 | ) | ||||||
|
|
|
|
|
|
|
|||||||
| Total deferred |
1,467 | 622 | 4 | |||||||||
|
|
|
|
|
|
|
|||||||
| Total income tax provision |
$ | 19,909 | $ | 10,243 | $ | 161 | ||||||
|
|
|
|
|
|
|
|||||||
The reconciliation between the effective income tax rate and the U.S. federal statutory rate is as follows:
| For the year ended | ||||||||||||
| December 31, | January 1, | January 2, | ||||||||||
| 2011 | 2011 | 2010 | ||||||||||
| U.S. federal taxes at statutory rate |
$ | 20,155 | $ | 11,075 | $ | 706 | ||||||
| Increase (decrease) |
||||||||||||
| Foreign tax credit |
(1,026 | ) | (227 | ) | — | |||||||
| Domestic production activity deduction |
(1,075 | ) | (519 | ) | — | |||||||
| Research and Development Tax Credit - Current Year |
(150 | ) | (150 | ) | (200 | ) | ||||||
| Foreign income taxed at lower rate |
(1,052 | ) | (584 | ) | (424 | ) | ||||||
| Nondeductible items |
1,049 | 40 | 67 | |||||||||
| State and local taxes, net |
907 | 465 | (40 | ) | ||||||||
| Change in reserve |
440 | 9 | 124 | |||||||||
| Other |
661 | 134 | (72 | ) | ||||||||
|
|
|
|
|
|
|
|||||||
| Income tax provision |
$ | 19,909 | $ | 10,243 | $ | 161 | ||||||
|
|
|
|
|
|
|
|||||||
49
Deferred income taxes reflect the net tax effects of temporary differences between the carrying amounts of assets and liabilities for financial reporting purposes and the amounts used for income taxes. The temporary differences that give rise to significant portions of the deferred tax assets and liabilities as of December 31, 2011 and January 1, 2011 are presented below:
| December 31, | January 1, | |||||||
| 2011 | 2011 | |||||||
| Deferred tax assets: |
||||||||
| Current: |
||||||||
| Accrued expenses and other |
$ | 260 | $ | 446 | ||||
|
|
|
|
|
|||||
| Total current deferred tax assets |
260 | 446 | ||||||
|
|
|
|
|
|||||
| Noncurrent: |
||||||||
| Accrued expenses and other |
2,028 | 1,008 | ||||||
|
|
|
|
|
|||||
| Total noncurrent deferred tax assets |
2,028 | 1,008 | ||||||
|
|
|
|
|
|||||
| Deferred tax liabilities: |
||||||||
| Noncurrent: |
||||||||
| Depreciation |
(8,484 | ) | (6,692 | ) | ||||
| Other |
(461 | ) | — | |||||
|
|
|
|
|
|||||
| Total noncurrent deferred tax liabilities |
(8,945 | ) | (6,692 | ) | ||||
|
|
|
|
|
|||||
| Net noncurrent deferred tax liability |
$ | (6,917 | ) | $ | (5,684 | ) | ||
|
|
|
|
|
|||||
A valuation allowance to reduce the deferred tax assets reported is required if, based on the weight of the evidence, it is more likely than not that some portion or all of the deferred tax assets will not be realized. For the fiscal years ended 2011 and 2010, management has determined that a valuation allowance is not required.
The Company intends and has the ability to indefinitely reinvest the earnings of its non-U.S. subsidiaries, which reflect full provision for non-U.S. income taxes, to expand its international operations. These earnings relate to ongoing operations and, at December 31, 2011, cumulative earnings were approximately $45 million. Accordingly, no provision has been made for U.S. income taxes that might be payable upon repatriation of such earnings. In the event any earnings of non-U.S. subsidiaries are repatriated, the Company will provide U.S. income taxes upon repatriation of such earnings, which will be offset by applicable foreign tax credits, subject to certain limitations.
The Company prescribes a recognition threshold and measurement attribute for an uncertain tax position taken or expected to be taken in a tax return.
50
The following is a roll-forward of the Company’s unrecognized tax benefits:
| Unrecognized tax benefits - December 27, 2008 |
$ | 36 | ||
| Increases from positions taken during prior periods |
124 | |||
| Lapse of statute of limitations |
— | |||
|
|
|
|||
| Unrecognized tax benefits - January 2, 2010 |
$ | 160 | ||
| Increases from positions taken during prior periods |
47 | |||
| Lapse of statute of limitations |
(38 | ) | ||
|
|
|
|||
| Unrecognized tax benefits - January 1, 2011 |
$ | 169 | ||
| Increases from positions taken during prior periods |
440 | |||
| Lapse of statute of limitations |
— | |||
|
|
|
|||
| Unrecognized tax benefits - December 31, 2011 |
$ | 609 |
At December 31, 2011, the Company had an unrecognized tax benefit of $609 including accrued interest. If recognized, the unrecognized tax benefit would have a favorable effect on the effective tax rate in future periods. The Company recognizes interest and penalties related to income tax matters in income tax expense. Interest related to the unrecognized tax benefit has been recognized and included in income tax expense. Interest accrued as of December 31, 2011, is not considered material to the Company’s Consolidated Financial Statements.
The Company files U.S. federal income tax returns as well as income tax returns in various states and foreign jurisdictions. The Company is no longer subject to income tax examinations by tax authorities for years prior to 2004 for the majority of tax jurisdictions.
The Company’s federal returns are currently under examination by the Internal Revenue Service (IRS) in the United States for the periods 2004 through 2009. The additional reserve during the current period in the table above is primarily related to an IRS proposal from Appeals regarding the Company’s research and development tax credit position. To date, there have not been any other significant proposed adjustments that have not been accounted for in the Company’s financial statements.
Audit outcomes and the timing of audit settlements are subject to significant uncertainty. It is reasonably possible that within the next twelve months the Company will resolve some or all of the matters presently under consideration for 2004 through 2009 with the IRS and that there could be significant increases or decreases to unrecognized tax benefits.
| 15. | STOCK OPTION PLANS |
During 1996, the Company adopted the 1996 Stock Option Plan (the “Stock Option Plan”), which provides for the grant of incentive stock options and nonqualified stock options for the purchase of up to an aggregate of 3,375,000 shares of the Company’s common stock by officers, employees and directors of the Company. Under the terms of the plan, incentive stock options may be granted to employees at an exercise price per share of not less than the fair value per common share on the date of the grant (not less than 110% of the fair value in the case of holders of more than 10% of the Company’s voting stock). Nonqualified stock options may be granted at the discretion of the Company’s Board of Directors. The maximum term of an option may not exceed 10 years, and options become exercisable at such times and in such installments as determined by the Board of Directors.
51
A summary of the Company’s stock option plan for the years ended December 31, 2011, January 1, 2011, and January 2, 2010 is summarized as follows:
| Number of shares |
Exercise price range | Weighted average exercise price |
||||||||||
| (share amounts are in thousands) | ||||||||||||
| Under option, December 27, 2008 |
29 | $ | 2.00 - 8.18 | $ | 3.97 | |||||||
| (29 shares exercisable) |
||||||||||||
| Granted |
— | $ | — - — | $ | — | |||||||
| Exercised |
(5 | ) | $ | 2.00 - 3.66 | $ | 2.44 | ||||||
| Forfeitures |
— | $ | — - — | $ | — | |||||||
|
|
|
|
|
|
|
|||||||
| Under option, January 2, 2010 |
24 | $ | 2.00 - 8.18 | $ | 4.26 | |||||||
|
|
|
|
|
|
|
|||||||
| (24 shares exercisable) |
||||||||||||
| Granted |
— | $ | — - — | $ | — | |||||||
| Exercised |
(15 | ) | $ | 2.00 - 3.66 | $ | 2.80 | ||||||
| Forfeitures |
— | $ | — - — | $ | — | |||||||
|
|
|
|
|
|
|
|||||||
| Under option, January 1, 2011 |
9 | $ | 3.66 - 8.18 | $ | 6.67 | |||||||
|
|
|
|
|
|
|
|||||||
| (9 shares exercisable) |
||||||||||||
| Granted |
— | $ | — - — | $ | — | |||||||
| Exercised |
(9 | ) | $ | 2.00 - 8.18 | $ | 6.67 | ||||||
| Forfeitures |
— | $ | — - — | $ | — | |||||||
|
|
|
|
|
|
|
|||||||
| Under option, December 31, 2011 |
— | $ | — - — | $ | — | |||||||
|
|
|
|
|
|
|
|||||||
| (0 shares exercisable) |
||||||||||||
As of December 31, 2011, all options under the 1996 Plan have been exercised and the Plan is no longer active.
The fair value of each option grant is estimated on the date of grant using the Black-Scholes option pricing model using weighted average assumptions. Stock option compensation expense for the periods ended December 31, 2011, and January 1, 2011, were $0 and $6, respectively.
There were no stock options granted during 2011, 2010 and 2009.
In September 2006, the Company adopted the 2006 Stock Option Plan (“2006 Plan”), which provides for the grant of incentive stock options and nonqualified stock options for the purchase of up to an aggregate of 1,125,000 shares of the Company’s common stock by officers, employees and directors of the Company. The Company adopted the 2006 Plan due to the expiration of the Company’s 1996 Stock Option Plan in 2006. Under the terms of the plan, incentive stock options may be granted to employees at an exercise price per share of not less than the fair value per common share on the date of the grant (not less than 110% of the fair value in the case of holders of more than 10% of the Company’s voting stock). Nonqualified stock options may be granted at the discretion of the Company’s Board of Directors. The maximum term of an option may not exceed 10 years, and options become exercisable at such times and in such installments as determined by the Board of Directors. No awards have been granted under the 2006 Plan.
During 2001, the Company adopted the 2001 Restricted Stock Plan, which provides for the grant of restricted stock of up to an aggregate of 928,125 shares of the Company’s common stock to officers, employees, consultants and directors of the Company. Under the terms of the plan, the minimum period before any shares become non-forfeitable may not be less than six months. Compensation cost has been measured at the date of the grant and is recognized in earnings over the period in which the shares vest. Restricted stock expense for the years ended December 31, 2011, January 1, 2011, and January 2, 2010, totaled $1,193, $880, and $794, respectively.
52
A summary of the Company’s restricted stock plan for the years ended December 31, 2011, January 1, 2011, and January 2, 2010, is summarized as follows:
| Number of shares |
Weighted average grant-date fair value |
|||||||
| Nonvested balance at December 27, 2008 |
110 | $ | 14.30 | |||||
| Granted |
61 | 13.98 | ||||||
| Vested |
(56 | ) | 15.24 | |||||
| Forfeitures |
(2 | ) | 15.21 | |||||
|
|
|
|
|
|||||
| Nonvested balance at January 2, 2010 |
113 | $ | 14.52 | |||||
| Granted |
69 | 20.74 | ||||||
| Vested |
(53 | ) | 15.60 | |||||
| Forfeitures |
— | — | ||||||
|
|
|
|
|
|||||
| Nonvested balance at January 1, 2011 |
129 | $ | 17.41 | |||||
| Granted |
88 | 28.41 | ||||||
| Vested |
(63 | ) | 16.04 | |||||
| Forfeitures |
— | — | ||||||
|
|
|
|
|
|||||
| Nonvested balance at December 31, 2011 |
154 | $ | 24.25 | |||||
|
|
|
|
|
|||||
The 2001 Restricted Stock Plan expired in 2011 and was replaced in September 2011 with the 2011 Equity Incentive Plan. This plan provides for the grant of up to an aggregate of 1,000,000 shares of restricted stock, restricted share units, stock appreciation rights, dividend or dividend equivalent rights, stock awards and other awards valued in whole or in part by reference to or otherwise based on the Company’s common stock to officers, employees and directors of the Company. The Plan will be submitted to the Company’s shareholders for approval at the 2012 Annual Meeting. The Company issued 88,238 shares under the new plan during the quarter ended December 31, 2011.
The Company has $3,213 of total unrecognized compensation cost related to restricted stock awards granted under the Plan as of December 31, 2011. That cost is expected to be recognized over a weighted average period of 1.74 years.
The Company maintains an Employee Stock Purchase Plan (“ESPP”), in which most employees are eligible to participate. Employees in the United States who choose to participate are granted an opportunity to purchase common stock at 85 percent of market value on the first or last day of the quarterly purchase period, whichever is lower. Employees in the United Kingdom are granted an opportunity to purchase common stock at market value, on the first or last day of the quarterly purchase period, whichever is lower, with the Company issuing one additional free share of common stock for each six shares purchased by the employee under the ESPP. The ESPP authorizes the issuance, and the purchase by employees, of up to 1,096,875 shares of common stock through payroll deductions. No U.S. employee is allowed to buy more than $25 of common stock in any year, based on the market value of the common stock at the beginning of the purchase period, and no U.K. employee is allowed to buy more than the lesser of £1.5 or 10% of their annual salary in any year. Employees purchased 29,056 shares at a weighted average price of $19.76, and 31,956 shares at a weighted average price of $13.24, under the ESPP during 2011 and 2010, respectively. The Company recognized $164 and $126 of compensation expense during 2011 and 2010, respectively. At December 31, 2011, 748,548 shares remained available to be issued through the ESPP.
The Company has a Nonemployee Director Equity and Deferred Compensation Plan (the “Plan”), which originally was adopted by the Board of Directors and approved by the shareholders in 2004. The Plan was amended on March 1, 2008 and was approved by the shareholders at the 2008 Annual Meeting. Under the Plan, Directors who are not officers of the Company are paid 375 shares of Company common stock and $3 in fees for attendance at each meeting of the Board of Directors, as well as each meeting of each Board Committee on which they serve when the committee meeting is not held within one day of a meeting of the Board of Directors. Additionally, the Board of Directors has the authority to increase from time to time, as it deems desirable or appropriate, the number of shares of stock awarded to all or any one or more of the Nonemployee Directors. No more than 25,000 shares of stock, in the aggregate, may be issued under the Plan during any single calendar year. Committee Chairmen currently receive additional fees equal to 25% of normal compensation and the Chairman of the Board is paid twice the amount of normal compensation, with such additional compensation payable in Company common stock.
53
Directors may elect under the Plan to receive all or part of their cash fees in Company stock and to defer receipt of their fees until a subsequent year. The Plan authorizes the issuance of up to 270,000 shares of common stock.
Directors were granted 14,936 and 16,342 shares during 2011 and 2010, respectively. At December 31, 2011, there were 49,032 deferred stock units outstanding. Deferred stock units are treated as liabilities. The Company recognized director stock compensation expense of $264 and $630, for 2011 and 2010, respectively. At December 31, 2011, 183,300 shares remained available to be issued through the Plan.
| 16. | EARNINGS PER SHARE |
The following table represents the computation of basic and diluted net income per common share (in thousands, except per share data):
| December 31, | January 1, | January 2, | ||||||||||
| 2011 | 2011 | 2010 | ||||||||||
| Net income |
$ | 37,677 | $ | 21,400 | $ | 1,856 | ||||||
| Basic weighted average number of common shares outstanding |
25,642 | 25,428 | 25,256 | |||||||||
| Basic net income per common share |
$ | 1.47 | $ | 0.84 | $ | 0.07 | ||||||
| Effect of dilutive stock options and deferred director stock units |
42 | 50 | 49 | |||||||||
| Diluted weighted average number of common shares outstanding |
25,684 | 25,478 | 25,305 | |||||||||
| Diluted net income per common share |
$ | 1.47 | $ | 0.84 | $ | 0.07 | ||||||
| 17. | EMPLOYEE BENEFITS |
The Company has a defined contribution retirement plan covering substantially all of its eligible United States employees. Employer contributions under the retirement plan amounted to approximately $5,026, $3,304, and $880 during 2011, 2010, and 2009, respectively.
The Company provides supplemental pension benefits to its employees of foreign operations in addition to mandatory benefits included in local country payroll tax statutes. These supplemental pension benefits amounted to approximately $336, $353, and $280 during 2011, 2010, and 2009, respectively.
The Company uses an Employee Stock Ownership Plan (“ESOP”) as the discretionary match portion of its 401(k) retirement plan. The Company contributes to the ESOP for all eligible United States employees. Under the ESOP, which is 100% company funded, the Company allocates common stock to each participants account. The allocation is generally a percentage of a participant’s compensation as determined by the Board of Directors on an annual basis.
In May 2008, the Board introduced the concept of a shared distribution dividend. The shared distribution dividend rewards the majority of employees through a contribution into their retirement accounts and concurrently rewards shareholders with a special cash dividend. As a result of the shared distribution, the Company contributed 84,974 and 265,241 shares into the ESOP in March 2011 and March 2009, respectively. In 2011, the Company accrued an amount equal to 13.5% of eligible wages in accordance with the shared distribution dividend announced in March 2012.
54
The Company incurred retirement benefit expense under the ESOP of approximately $3,849, $2,255, and zero during 2011, 2010 and 2009, respectively. These amounts are included in the total employer contributions to the retirement plan noted above.
There are no restrictions on the shares contributed to the ESOP. This allows participants to sell their shares to enable diversification within their individual 401(k) accounts. The Company does not have any repurchase obligations under the ESOP.
During 2008, the Company developed plans for international employees to participate in the shared distributions. The Company’s foreign operations recognized total expense of approximately $795, $483, and zero in 2011, 2010, and 2009, respectively, relating to shared distributions. The Company’s U.K. employees received 8,061 and 34,869 shares in March 2011 and March 2009, respectively, into a share incentive plan, while employees in the remaining locations received their shared distribution in the form of cash. In Korea the cash was deposited into a Company retirement plan. In Germany, 50% of the shared distribution was paid in cash and the remaining 50% is expected to be paid in Company stock in 2012.
The Company awards deferred cash bonuses to key employees of its foreign operations. The deferred cash bonuses are similar to phantom stock units, in that such bonuses are tied to the value of the Company’s common stock. Awards are recognized over the deferral period as variable plan awards. The Company recognized approximately $45, $45 and $54 of compensation expense in 2011, 2010 and 2009, respectively, related to the awards.
| 18. | SEGMENT REPORTING |
The individual subsidiaries comprising the Company operate predominantly in a single industry as manufacturers and distributors of hydraulic components. The Company is multinational with operations in the United States, and subsidiaries in the United Kingdom, Germany, Korea, and France. Amounts for France, due to their immateriality, are included with the U.S. France operated as a subsidiary of the Company until its dissolution in November 2011, at which time it became a liaison office. In computing operating profit for the foreign subsidiaries, no allocations of general corporate expenses have been made. Management bases its financial decisions by the geographical location of its operations.
55
Total assets of the foreign subsidiaries are those assets related to the operation of those companies. United States assets consist of all other operating assets of the Company. Segment information is as follows:
| United | United | |||||||||||||||||||||||
| States | Korea | Germany | Kingdom | Elimination | Consolidated | |||||||||||||||||||
| 2011 |
||||||||||||||||||||||||
| Sales to unaffiliated customers |
$ | 131,714 | $ | 20,566 | $ | 27,997 | $ | 23,894 | $ | — | $ | 204,171 | ||||||||||||
| Intercompany sales |
33,711 | — | 201 | 1,536 | (35,448 | ) | — | |||||||||||||||||
| Operating income |
41,847 | 2,492 | 6,715 | 4,167 | 48 | 55,269 | ||||||||||||||||||
| Total assets |
116,496 | 11,996 | 19,016 | 20,747 | (727 | ) | 167,528 | |||||||||||||||||
| Depreciation and amortization |
5,308 | 114 | 357 | 942 | 6,721 | |||||||||||||||||||
| Capital expenditures |
9,324 | 274 | 63 | 482 | 10,143 | |||||||||||||||||||
| 2010 |
||||||||||||||||||||||||
| Sales to unaffiliated customers |
$ | 94,067 | $ | 16,284 | $ | 19,770 | $ | 20,574 | $ | — | $ | 150,695 | ||||||||||||
| Intercompany sales |
26,022 | — | 160 | 1,225 | (27,407 | ) | — | |||||||||||||||||
| Operating income |
22,040 | 2,246 | 4,024 | 2,822 | (93 | ) | 31,039 | |||||||||||||||||
| Total assets |
89,977 | 10,535 | 14,705 | 17,605 | (788 | ) | 132,034 | |||||||||||||||||
| Depreciation and amortization |
5,388 | 89 | 429 | 967 | 6,873 | |||||||||||||||||||
| Capital expenditures |
3,400 | 217 | 27 | 212 | 3,856 | |||||||||||||||||||
| 2009 |
||||||||||||||||||||||||
| Sales to unaffiliated customers |
$ | 59,278 | $ | 9,978 | $ | 14,654 | $ | 13,483 | $ | — | $ | 97,393 | ||||||||||||
| Intercompany sales |
15,545 | — | 139 | 1,101 | (16,785 | ) | — | |||||||||||||||||
| Operating income (loss) |
(2,110 | ) | 616 | 2,475 | 884 | 278 | 2,143 | |||||||||||||||||
| Total assets |
85,338 | 8,191 | 12,447 | 15,923 | (1,966 | ) | 119,933 | |||||||||||||||||
| Depreciation and amortization |
5,335 | 104 | 502 | 1,027 | 6,968 | |||||||||||||||||||
| Capital expenditures |
4,758 | 41 | 30 | 267 | 5,096 | |||||||||||||||||||
Sales to unaffiliated customers represent sales from each of the individual subsidiaries. For information on sales to geographic locations, see the Comparisons of the Years Ended December 31, 2011, and January 1, 2011, in Management’s Discussion and Analysis of Financial Condition and Results of Operations. Operating income is total sales and other operating income less operating expenses. Segment operating income does not include interest income/expense, foreign currency transaction gain/loss, and net miscellaneous income/expense.
Included in U.S. sales to unaffiliated customers were export sales of $49,753, $34,955, and $19,031, during 2011, 2010, and 2009, respectively. Export sales to Canada and Asia/Pacific totaling, $34,506, $24,705, and $12,918, during 2011, 2010, and 2009, respectively, make up the majority of these export sales. Additionally, export sales to Europe were $12,474, $8,066 and $4,916 during 2011, 2010, and 2009, respectively.
| 19. | COMMITMENTS AND CONTINGENCIES |
The Company is not a party to any legal proceedings other than routine litigation incidental to its business. In the opinion of management, the amount of ultimate liability with respect to these actions will not materially affect the results of operations, financial position or cash flows of the Company.
OPERATING LEASES - The Company leases a manufacturing facility in Lenexa, Kansas and production support facilities in Sarasota, Florida under operating leases having initial terms expiring in 2010. The lease for the manufacturing facility in Kansas is currently on a month to month basis, and represents approximately 17,000 square feet of space. The lease for the production support facilities in Florida is expiring in April, 2012, and represents approximately 10,000 square feet. Total rental expense for the years ended 2011, 2010 and 2009 was approximately $294, $229 and $221, respectively.
56
Future minimum lease payments on operating leases are as follows:
| 2012 |
36 | |||
|
|
|
|||
| Total minimum lease payments |
$ | 36 | ||
|
|
|
INSURANCE - The Company accrues for health care benefit costs under a self-funded plan. The Company purchases re-insurance for both specific and aggregate stop losses on claims that exceed $115 on an individual basis and approximately $7,600 on an aggregate basis. The Company records a liability for all unresolved claims at the anticipated cost to the Company at the end of the period based on management’s assessment. The Company believes it has adequate reserves for all self-insurance claims.
| 20. | UNAUDITED QUARTERLY FINANCIAL INFORMATION |
Quarterly Results of Operations
(In thousands, except per share data)
| For the Quarter Ended | ||||||||||||||||
| Dec 31, 2011 |
Oct 1, 2011 |
Jul 2, 2011 |
Apr 2, 2011 |
|||||||||||||
| Net sales |
$ | 45,657 | $ | 53,041 | $ | 54,770 | $ | 50,703 | ||||||||
| Gross profit |
16,848 | 20,748 | 21,674 | 19,942 | ||||||||||||
| Operating income |
10,472 | 15,499 | 15,384 | 13,911 | ||||||||||||
| Income before income taxes |
10,614 | 16,982 | 15,571 | 14,417 | ||||||||||||
| Net income |
$ | 6,074 | $ | 11,394 | $ | 10,437 | $ | 9,770 | ||||||||
|
|
|
|
|
|
|
|
|
|||||||||
| Basic net income per common share |
$ | 0.24 | $ | 0.44 | $ | 0.41 | $ | 0.38 | ||||||||
| Diluted net income per common share |
$ | 0.24 | $ | 0.44 | $ | 0.41 | $ | 0.38 | ||||||||
| For the Quarter Ended | ||||||||||||||||
| Jan 1, 2011 |
Oct 2, 2010 |
Jul 3, 2010 |
Apr 3, 2010 |
|||||||||||||
| Net sales |
$ | 41,772 | $ | 38,073 | $ | 39,246 | $ | 31,605 | ||||||||
| Gross profit |
14,689 | 13,550 | 13,984 | 10,120 | ||||||||||||
| Operating income |
8,754 | 8,182 | 9,139 | 4,964 | ||||||||||||
| Income before income taxes |
8,762 | 8,409 | 9,323 | 5,148 | ||||||||||||
| Net income |
$ | 6,267 | $ | 5,709 | $ | 6,113 | $ | 3,311 | ||||||||
|
|
|
|
|
|
|
|
|
|||||||||
| Basic net income per common share |
$ | 0.25 | $ | 0.23 | $ | 0.24 | $ | 0.13 | ||||||||
| Diluted net income per common share |
$ | 0.25 | $ | 0.23 | $ | 0.24 | $ | 0.13 | ||||||||
| 21. | NEW ACCOUNTING PRONOUNCEMENTS |
In May 2011, the Financial Accounting Standards Board (“FASB”) issued guidance amending certain fair value measurement and disclosure requirements in U.S. GAAP and IFRS. The amendments change the wording used to describe many of the requirements in U.S. GAAP for measuring fair value and for disclosing information about fair value measurements. The amendments are intended to create comparability of fair value measurements presented and disclosed in financial statements prepared in accordance with U.S. Generally Accepted Accounting Principles and International Financial Reporting Standards. This guidance is effective for interim and annual periods beginning after December 15, 2011. The Company does not expect material financial statement implications relating to the adoption of this guidance.
57
In June 2011, the FASB issued guidance amending the presentation of comprehensive income. This amends existing guidance by allowing only two options for presenting the components of net income and other comprehensive income: (1) in a single continuous financial statement, statement of comprehensive income or (2) in two separate but consecutive financial statements, consisting of an income statement followed by a separate statement of other comprehensive income. Also, items that are reclassified from other comprehensive income to net income must be presented on the face of the financial statements. The guidance requires retrospective application, and it is effective for fiscal years, and interim periods within those years, beginning after December 15, 2011. We believe the adoption of this update will change the order in which certain financial statements are presented and provide additional detail on those financial statements when applicable, but will not have any other material impact on our consolidated financial statements. In December 2011, the FASB issued another amendment to defer certain requirements from the June 2011 guidance that relate to the presentation of reclassification adjustments. The amendments will allow the FASB time to redeliberate whether to present on the face of the financial statements the effects of reclassifications out of accumulated other comprehensive income on the components of net income and other comprehensive income for all periods presented. We are in the process of evaluating the disclosure impact of this guidance.
In September 2011, the FASB amended the guidance on the annual testing of goodwill for impairment. The amended guidance will allow companies to assess qualitative factors to determine if it is more-likely-than-not that goodwill might be impaired and whether it is necessary to perform the two-step goodwill impairment test required under current accounting standards. This guidance will be effective for the Company’s fiscal year ending December 30, 2012, with early adoption permitted. The Company has determined that this new guidance will not have a material impact on its consolidated financial statements.
ITEM 9. CHANGES IN AND DISAGREEMENTS WITH
ACCOUNTANTS ON ACCOUNTING AND FINANCIAL DISCLOSURE
None.
ITEM 9A. CONTROLS AND PROCEDURES
Disclosure Controls and Procedures
The Company’s management, with the participation of the Chief Executive Officer and Chief Financial Officer, after evaluating the effectiveness of the Company’s “disclosure controls and procedures” (as defined in Rules 13a-15(e) and 15d-15(e) under the Securities Exchange Act of 1934, as amended) as of the end of the period covered by this report, have concluded that our disclosure controls and procedures are effective and are designed to ensure that the information we are required to disclose is recorded, processed, summarized and reported within the necessary time periods. Our disclosure controls and procedures include, without limitation, controls and procedures designed to ensure that information required to be disclosed by us in reports that we file or submit pursuant to the Securities Exchange Act of 1934, as amended, is accumulated and communicated to our management, including our Chief Executive Officer and Chief Financial Officer, as appropriate to allow timely decisions regarding required disclosure.
Management’s Report on Internal Control over Financial Reporting
Management of the Company is responsible for establishing and maintaining adequate internal control over financial reporting, as such term is defined in Exchange Act Rule 13a-15(f). The Company’s internal control over financial reporting is a process designed to provide reasonable assurance regarding the reliability of financial reporting and the preparation of financial statements for external purposes in accordance with generally accepted accounting principles. Internal control over financial reporting includes those policies and procedures that:
| • | pertain to the maintenance of records that, in reasonable detail, accurately and fairly reflect the transactions and dispositions of the assets of the Company; |
58
| • | provide reasonable assurance that transactions are recorded, as necessary, to permit preparation of financial statements in accordance with generally accepted accounting principles, and that receipts and expenditures of the Company are being made only in accordance with authorizations of management and directors of the Company; and |
| • | provide reasonable assurance regarding prevention or timely detection of unauthorized acquisition, use or disposition of the Company’s assets that could have a material effect on the financial statements. |
Because of its inherent limitations, internal control over financial reporting may not prevent or detect misstatements. Management, with the participation of the Chief Executive Officer and Chief Financial Officer, conducted an evaluation of the effectiveness of the Company’s internal control over financial reporting based on the criteria set forth in Internal Control - Integrated Framework issued by the Committee of Sponsoring Organizations of the Treadway Commission. Based on this evaluation under the Internal Control - Integrated Framework, management, with the participation of the Chief Executive Officer and Chief Financial Officer, concluded that the internal control over financial reporting was effective as of December 31, 2011.
The SEC’s general guidance permits the exclusion of an assessment of the effectiveness of a registrant’s controls and procedures as they relate to its internal control over financial reporting for an acquired business during the first year following such acquisition if, among other circumstances and factors, there is not an adequate amount of time between the acquisition date and the date of assessment. As previously disclosed in this Form 10-K, during the third quarter of 2011, we completed our acquisition of HCT. In accordance with the SEC guidance, the scope of our evaluation of internal controls over financial reporting as of December 31, 2011 did not include the internal control over financial reporting of these acquired operations. Assets acquired from HCT represent approximately 4% of our total consolidated assets at December 31, 2011 and net revenue generated by HCT subsequent to the date of acquisition represents less than 1% of our consolidated net revenue for the year ended December 31, 2011. As part of our acquisition of HCT, we continue to evaluate HCT’s internal controls over financial reporting. From the acquisition date to December 31, 2011, the processes and systems of HCT’s acquired operations did not significantly impact our internal control over financial reporting.
Changes in Internal Control Over Financial Reporting
There were no changes in the Company’s internal control over financial reporting during the quarter ended December 31, 2011, that materially affected, or are reasonably likely to materially affect, the Company’s internal control over financial reporting.
Attestation Report of Independent Registered Public Accounting Firm
Mayer Hoffman McCann P.C., our independent registered public accounting firm, has issued an attestation report on our internal control over financial reporting. This report appears on page 32.
ITEM 9B. OTHER INFORMATION
None.
59
PART III.
ITEM 10. DIRECTORS, EXECUTIVE OFFICERS OF THE REGISTRANT AND CORPORATE
GOVERNANCE MATTERS
Executive Officers
The information required by this item with respect to our executive officers is set forth in our 2012 Proxy Statement under the caption “Governance of the Company” and is incorporated herein by reference.
Directors
The information required by this item with respect to our board of directors and committees thereof is set forth in our 2012 Proxy Statement under the caption “Governance of the Company” and is incorporated herein by reference.
Section 16(a) Beneficial Ownership Reporting Compliance
The information required by this item with respect to Section 16(a) beneficial ownership reporting compliance is set forth in our 2012 Proxy Statement under the caption “Compliance with Section 16(a) of the Securities Exchange Act of 1934” and is incorporated herein by reference.
Code of Business Conduct and Ethics
The information required by this item with respect to our Code of Business Conduct and Ethics is set forth in our 2012 Proxy Statement under the caption “Governance of the Company” and is incorporated herein by reference.
ITEM 11. EXECUTIVE COMPENSATION
The information required by this item is set forth under the caption “Executive Compensation” in our 2012 Proxy Statement and is incorporated herein by reference.
ITEM 12. SECURITY OWNERSHIP OF CERTAIN
BENEFICIAL OWNERS AND MANAGEMENT AND RELATED STOCKHOLDER MATTERS
The information required by this item with respect to equity compensation plans is set forth under the caption “Equity Compensation Plan Information” in our 2012 Proxy Statement and with respect to security ownership of certain beneficial owners, directors and executive officers is set forth under the caption “Security Ownership of Certain Beneficial Owners and Management” in our 2012 Proxy Statement and is incorporated herein by reference.
ITEM 13. CERTAIN RELATIONSHIPS, RELATED TRANSACTIONS AND DIRECTOR INDEPENDENCE
The information required by this item is set forth under the captions “Compensation Committee Interlocks and Insider Participation,” “Certain Relationships and Related Transactions” and “Independence and Committees of the Board of Directors” in our 2012 Proxy Statement and is incorporated herein by reference.
ITEM 14. PRINCIPAL ACCOUNTING FEES AND SERVICES
The information required by this item is set forth under the caption “Independent Registered Public Accounting Firm” in our 2012 Proxy Statement and is incorporated herein by reference.
60
PART IV
| ITEM 15. | EXHIBITS AND FINANCIAL STATEMENT SCHEDULES |
| 1. |
The following financial statements are included in Part II, Item 8: |
|||||
| 33 | ||||||
| 35 | ||||||
| Consolidated Balance Sheets as of December 31, 2011 and January 1, 2011 |
36 | |||||
| 37 | ||||||
| 38 | ||||||
| 39 | ||||||
| 40 | ||||||
| 2. |
Exhibits: | |||||
| Exhibit Number |
Exhibit Description | |
| 3.1 |
Amended and Restated Articles of Incorporation of the Company (previously filed as Exhibit 3.1 in the Pre-Effective Amendment No. 4 to the Company’s Registration Statement on Form S-1 filed on December 19, 1996 (File No. 333-14183) and incorporated herein by reference). | |
| 3.2 |
Amended and Restated Bylaws of the Company (previously filed as Exhibit 3.2 to the Company’s Form 10-K filed on March 9, 2011, and incorporated herein by reference). | |
| 3.3 |
Articles of Amendment to Articles of Incorporation effective June 8, 2011 (previously filed as Exhibit 3.1 to the Company’s Form 8-K filed on June 6, 2011, and incorporated herein by reference). | |
| 10.1+ |
Form of Indemnification Agreement (previously filed as Exhibit 10.4 in the Pre-Effective Amendment No. 4 to the Company’s Registration Statement on Form S-1 filed on December 19, 1996 (File No. 333-14183) and incorporated herein by reference). | |
61
| 10.2 |
Form of Distributor Agreement (Domestic) (previously filed as Exhibit 10.1 in the Company’s Registration Statement on Form S-1 filed on October 15, 1996 (File No. 333-14183) and incorporated herein by reference). | |
| 10.3 |
Form of Distributor Agreement (International) (previously filed as Exhibit 10.2 in the Company’s Registration Statement on Form S-1 filed on October 15, 1996 (File No. 333-14183) and incorporated herein by reference). | |
| 10.4 |
Credit and Security Agreement dated August 11, 2005, between the Company, as Borrower, and Fifth Third Bank, as Lender (previously filed as Exhibit 4.1 to the Company’s Quarterly Report on Form 10-Q for the quarter ended October 1, 2005 and incorporated herein by reference). | |
| 10.5 |
Renewal and Future Advance Revolving Line of Credit Promissory Note dated August 11, 2005, between the Company, as Borrower, and Fifth Third Bank, as Lender (previously filed as Exhibit 4.2 to the Company’s Quarterly Report on Form 10-Q for the quarter ended October 1, 2005 and incorporated herein by reference). | |
| 10.6 |
Renewed, Amended and Restated Mortgage and Security Agreement dated August 11, 2005, between the Company, as Mortgagor, and Fifth Third Bank, as Mortgagee (previously filed as Exhibit 4.3 to the Company’s Quarterly Report on Form 10-Q for the quarter ended October 1, 2005 and incorporated herein by reference). | |
| 10.7 |
Amended and Restated Credit and Security Agreement dated August 11, 2011, between the Company as Borrower, and Fifth Third Bank, as Lender. | |
| 10.8 |
Construction and Term Note, dated August 11, 2011, made by the Company in favor of Fifth Third Bank. | |
| 10.9 |
Amended and Restated Revolving Line of Credit Note, dated August 11, 2011, made by the Company in favor of Fifth Third Bank. | |
| 10.10+ |
1996 Sun Hydraulics Corporation Stock Option Plan (previously filed as Exhibit 10.3 in the Pre-Effective Amendment No. 4 to the Company’s Registration Statement on Form S-1 filed on December 19, 1996 (File No. 333-14183) and incorporated herein by reference). | |
| 10.11+ |
Amendment No. 1 to 1996 Stock Option Plan (previously filed as Exhibit 10.4 to the Company’s Quarterly Report on Form 10-Q for the quarter ended June 30, 1997 and incorporated herein by reference). | |
| 10.12+ |
Forms of agreement for grants under the Sun Hydraulics Corporation 1996 Stock Option Plan (previously filed as Exhibit 10.12+ to the Company’s Quarterly Report on Form 10-Q for the quarter ended September 25, 2004 and incorporated herein by reference). | |
| 10.13+ |
Sun Hydraulics Corporation 2006 Stock Option Plan (previously filed as Exhibit 99.2 to the Company’s Form 8-K filed on September 14, 2006 and incorporated herein by reference). | |
| 10.14+ |
Sun Hydraulics Corporation Employee Stock Award Program (previously filed as Exhibit 4 to the Company’s registration statement on Form S-8 filed on July 20, 1999, and incorporated herein by reference). | |
| 10.15+ |
2001 Sun Hydraulics Corporation Restricted Stock Plan (previously filed as Exhibit 4 to the Company’s registration statement on Form S-8 filed on June 12, 2001 (file No. 333-62816), and incorporated herein by reference). | |
| 10.16+ |
Form of agreement for grants of restricted shares under the Sun Hydraulics Corporation Restricted Stock Plan (previously filed as Exhibit 10.14 to the Company’s Annual Report on Form 10-K filed on March 15, 2010, and incorporated herein by reference). | |
| 10.17+ |
Sun Hydraulics Corporation Employee Stock Purchase Plan (previously filed as Exhibit 10.14 to the Company’s Form 10-K filed on March 9, 2011, and incorporated herein by reference). | |
62
| 10.18+ |
Sun Hydraulics Corporation 2004 Nonemployee Director Equity and Deferred Compensation Plan (As Amended and Restated Effective March 1, 2008) (previously filed as Appendix A to the Company’s Proxy Statement for the 2008 Annual Meeting of Shareholders filed with the Commission on April 25, 2008 and incorporated herein by reference). | |
| 10.19+ |
Amendment to Sun Hydraulics Corporation Amended and Restated 2004 Nonemployee Directory Equity and Deferred Compensation Plan (previously filed as Exhibit 10.1 to the Company’s Quarterly Report on Form 10-Q for the quarter ended July 2, 2011, and incorporated herein by reference). | |
| 10.20+ |
Form of Performance Share Agreement (previously filed as Exhibit 99.1 to the Company’s Form 8-K filed on December 16, 2004 and incorporated herein by reference). | |
| 10.21+ |
The Sun Hydraulics Corporation 401(k) and ESOP Retirement Plan dated December 12, 2007 (previously filed as Exhibit 10.17 to the Company’s Form 10-K filed on March 11, 2009 and incorporated herein by reference). | |
| 10.22+ |
First, Second, Third, Fourth, Fifth and Sixth Amendments to Sun Hydraulics Corporation 401(k) and ESOP Retirement Plan. | |
| 10.23+ |
2011 Equity Incentive Plan (previously filed as Exhibit 4.1 to the Company’s Registration Statement on Form S-8 filed on October 21, 2011 (File Number 333-177448) and incorporated herein by reference). | |
| 10.24+ |
Form of agreement for grants of restricted shares under the Sun Hydraulics 2011 Equity Incentive Plan. | |
| 10.25+ |
Sun Hydraulics Limited Share Incentive Plan (previously filed as Exhibit 4 to the Company’s Registration Statement on Form S-8 filed on March 27, 2009 (File Number 333158245) and incorporated herein by reference). | |
| 10.26+ |
Peter Robson Employment Agreement dated April 22, 1981 (previously filed as Exhibit 10.1+ to the Company’s Quarterly Report on Form 10-Q filed on May 6, 2009 and incorporated herein by reference). | |
| 10.27+ |
Steven Hancox Employment Agreement dated January 1, 1994 (previously filed as Exhibit 10.2+ to the Company’s Quarterly Report on Form 10-Q for the quarter ended April 2, 2011, and incorporated herein by reference). | |
| 10.28+ |
Executive Continuity Agreement, dated December 7, 2009, between Sun Hydraulics Corporation and Allen J. Carlson (previously filed as Exhibit 99.1 to the Company’s Form 8-K filed on December 11, 2009 and incorporated herein by reference). | |
| 10.29+ |
Executive Continuity Agreement, dated December 7,2009, between Sun Hydraulics Corporation and Tricia L. Fulton (previously filed as Exhibit 99.2 to the Company’s Form 8-K filed on December 11, 2009 and incorporated herein by reference). | |
| 10.30 |
Securities Purchase Agreement between Sun Hydraulics Corporation and High Country Tek, Inc., dated November 30, 2007 (previously filed as Exhibit 99.1 in the Company’s Form 8-K filed on November 30, 2007 and incorporated herein by reference). | |
63
| 14 |
Code of Ethics (previously filed as Exhibit 14 in the Company’s Annual report on Form 10-K for the year ended December 31, 2005 and incorporated herein by reference). | |
| 21 |
Subsidiaries of the Registrant. | |
| 23.1 |
Mayer Hoffman McCann P.C. Consent of Independent Registered Public Accounting Firm. | |
| 23.2 |
Kirkland, Russ, Murphy and Tapp, P.A. Consent of Independent Registered Public Accounting Firm. | |
| 31.1 |
CEO Certification pursuant to Section 302 of the Sarbanes-Oxley Act of 2002. | |
| 31.2 |
CFO Certification pursuant to Section 302 of the Sarbanes-Oxley Act of 2002. | |
| 32.1 |
CEO Certification pursuant to 18 U.S.C. § 1350. | |
| 32.2 |
CFO Certification pursuant to 18 U.S.C. § 1350. | |
| 101.INS |
XBRL Instance Document | |
| 101.SCH |
XBRL Schema Document | |
| 101.CAL |
XBRL Calculation Linkbase Document | |
| 101.DEF |
XBRL Definition Linkbase Document | |
| 101.LAB |
XBRL Label Linkbase Document | |
| 101.PRE |
XBRL Presentation Linkbase Document | |
| + | Executive management contract or compensatory plan or arrangement. |
64
SIGNATURES
Pursuant to the requirements of Section 13 or 15(d) of the Securities Exchange Act of 1934, the Registrant has duly caused this Report to be signed on its behalf by the undersigned, thereunto duly authorized, in the City of Sarasota, State of Florida on March 13, 2012.
| SUN HYDRAULICS CORPORATION | ||
| By: | /s/ Allen J. Carlson | |
| Allen J. Carlson, President and Chief Executive Officer | ||
Pursuant to requirements of the Securities Exchange Act of 1934, this Report has been signed by the following persons on behalf of the Registrant and in the capacities indicated as of March 13, 2012.
| Signature |
Title | |||
| /s/ Allen J. Carlson |
President, Chief Executive Officer and Director | |||
| Allen J. Carlson | ||||
| /s/ Tricia L. Fulton |
Chief Financial Officer (Principal Financial and Accounting Officer) | |||
| Tricia L. Fulton | ||||
| /s/ Marc Bertoneche |
Director | |||
| Marc Bertoneche | ||||
| /s/ Wolfgang H. Dangel |
Director | |||
| Wolfgang H. Dangel | ||||
| /s/ John S. Kahler |
Director | |||
| John S. Kahler | ||||
| /s/ Christine L. Koski |
Director | |||
| Christine L. Koski | ||||
| /s/ Philippe Lemaitre |
Director | |||
| Philippe Lemaitre | ||||
| /s/ Ferdinand E. Megerlin |
Director, Chairman of the Board of Directors | |||
| Ferdinand E. Megerlin | ||||
| /s/ David N. Wormley |
Director | |||
| David N. Wormley | ||||
65