|
|
SECURITIES AND EXCHANGE COMMISSION
WASHINGTON, D.C. 20549
FORM 10-K
ANNUAL REPORT PURSUANT TO SECTION 13 OR 15(d)
OF THE SECURITIES EXCHANGE ACT OF 1934
|
For the fiscal year ended December 29, 2018 |
|
Commission file number 0-21835 |
SUN HYDRAULICS CORPORATION
(Exact Name of Registration as Specified in its Charter)
|
FLORIDA |
|
59-2754337 |
|
(State or Other Jurisdiction of Incorporation or Organization) |
|
(I.R.S. Employer Identification No.) |
|
1500 WEST UNIVERSITY PARKWAY SARASOTA, FLORIDA |
|
34243 |
|
(Address of Principal Executive Offices) |
|
(Zip Code) |
941/362-1200
(Registrant’s Telephone Number, Including Area Code)
Securities registered pursuant to Section 12(b) of the Act:
|
|
|
|
|
Title of Each Class |
|
Name of each exchange on which registered |
|
Common Stock $.001 Par Value |
|
The NASDAQ Global Select Market |
Securities registered pursuant to Section 12(g) of the Act: None
Indicate by check mark if the registrant is a well-known seasoned issuer, as defined in Rule 405 of the Securities Act. Yes ☒ No ☐
Indicate by check mark if the registrant is not required to file reports pursuant to Section 13 or Section 15(d) of the Exchange Act. Yes ☐ No ☒
Indicate by check mark whether the Registrant (1) has filed all reports required to be filed by Section 13 or 15(d) of the Securities Exchange Act of 1934 during the preceding 12 months (or for such shorter period that the Registrant was required to file such reports), and (2) has been subject to such filing requirements for the past 90 days. Yes ☒ No ☐
Indicate by check mark whether the registrant has submitted electronically every Interactive Data File required to be submitted pursuant to Rule 405 of Regulation S-T (§ 232.405 of this chapter) during the preceding 12 months (or for such shorter period that the registrant was required to submit such files). Yes ☒ No ☐
Indicate by check mark if disclosure of delinquent filers pursuant to Item 405 of Regulation S-K (§ 229.405 of this chapter) is not contained herein, and will not be contained, to the best of Registrant's knowledge, in definitive proxy or information statements incorporated by reference in Part III of this Form 10-K or any amendment to this Form 10-K. ☐
Indicate by check mark whether the registrant is a large accelerated filer, an accelerated filer, a non-accelerated filer, smaller reporting company, or an emerging growth company. See the definitions of “large accelerated filer,” “accelerated filer,” “smaller reporting company,” and “emerging growth company” in Rule 12b-2 of the Exchange Act.
|
Large accelerated filer |
☒ |
Accelerated filer |
☐ |
|
Non-accelerated filer |
☐ |
Smaller Reporting Company |
☐ |
|
Emerging growth company |
☐ |
|
|
If an emerging growth company, indicate by check mark if the registrant has elected not to use the extended transition period for complying with any new or revised financial accounting standards provided pursuant to Section 13(a) of the Exchange Act. ☐
Indicate by check mark whether the registrant is a shell company (as defined in Rule 12b-2 of the Exchange Act). Yes ☐ No ☒
The aggregate market value of the shares of voting common stock held by non-affiliates of the Registrant, computed by reference to the closing sales price of such shares on the Nasdaq Stock Market, LLC, as of the last business day of the Registrant’s most recently completed second fiscal quarter was $1,373,530,467.
The Registrant had 31,978,284 shares of common stock, par value $.001, outstanding as of February 15, 2019.
Our Business
Overview
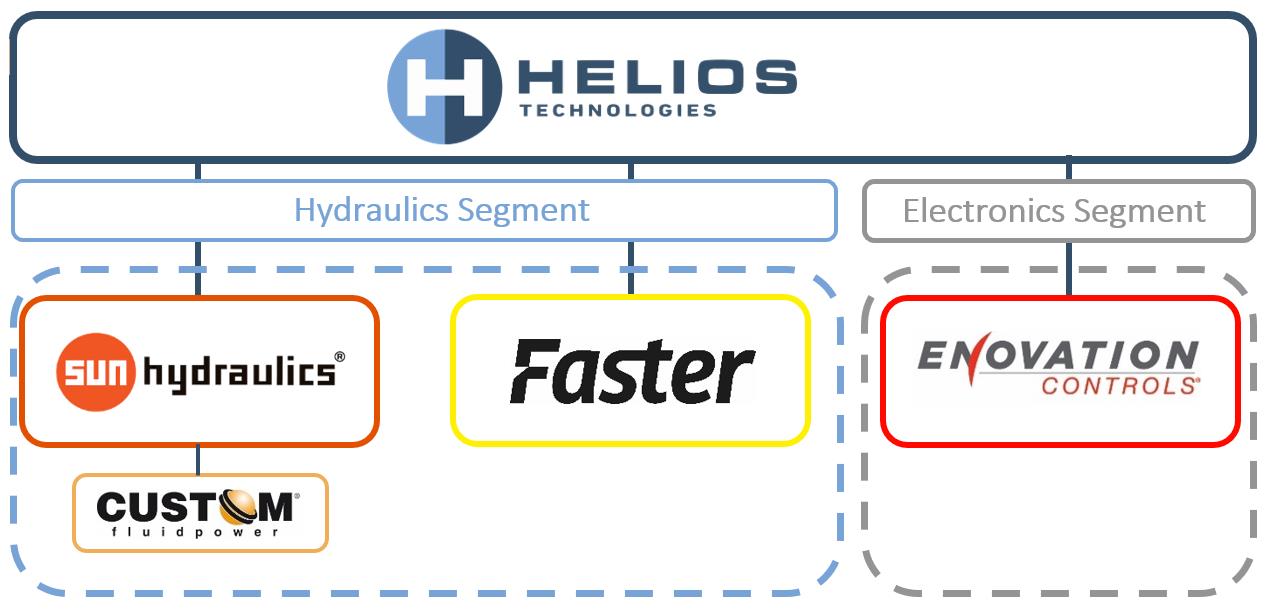
Sun Hydraulics Corporation, doing business as Helios Technologies (“Helios,” the “Company,” “we” or “our”), and its wholly-owned subsidiaries, is an industrial technology leader that develops and manufactures solutions for both the hydraulics and electronics markets. On August 6, 2018, we announced the adoption of Helios Technologies as our business name. Sun Hydraulics, LLC (“Sun Hydraulics” or “Sun”) (a newly-formed Florida limited liability company that holds the historical net operating assets of the Sun Hydraulics brand entities and Custom Fluidpower Pty Ltd, “Custom Fluidpower” or “CFP”), along with Enovation Controls, LLC (“Enovation Controls”) and Faster S.r.l. (“Faster”), are the three wholly-owned operating subsidiaries of Helios Technologies under the new holding company name.
We operate in two business segments, Hydraulics and Electronics. The Hydraulics segment consists of the global Sun Hydraulics companies, Faster, acquired in the second quarter of 2018, and Custom Fluidpower, acquired in the third quarter of 2018. Sun Hydraulics serves the hydraulics market as a leading manufacturer of high-performance screw-in hydraulic cartridge valves, electro-hydraulics, manifolds, and integrated package solutions for the worldwide industrial and mobile hydraulics markets. Faster is a leading global manufacturer of quick release hydraulic coupling solutions focused in the agriculture, construction equipment and industrial markets. Custom Fluidpower is a global provider of hydraulic, pneumatic, electronic and instrumentation solutions to a broad range of industries including agriculture, industrial, mining and material handling. The Electronics segment, comprised of Enovation Controls, LLC, is a global provider of innovative electronic control, display and instrumentation solutions for both recreational and off-highway vehicles, as well as stationary and power generation equipment. Our operational organization chart is presented below.
|
|
2
Sun Hydraulics was founded in 1970 and is a wholly owned subsidiary of Helios with its headquarters in Sarasota, Florida. The majority of Sun’s manufacturing operations reside in Sarasota with additional operations in the U.K., Germany and South Korea, as well as sales offices in China, India and South America. Enovation Controls, which was acquired on December 5, 2016 and is a wholly owned subsidiary of Helios, was formed in 2009 in connection with the reorganization of Murphy Group, Inc. and EControls Group, Inc. which were founded in 1939 and 1994, respectively. Enovation Controls operates the majority of its manufacturing in Tulsa, OK with sales and engineering capabilities in Texas, the U.K., China and India. Faster, which was acquired on April 5, 2018 and is a wholly owned subsidiary of Helios, was formed in 1951. Headquartered near Milan, Italy, Faster has manufacturing operations co-located with its headquarters as well as in Ohio and India. Additionally, the company has sales offices in China, Brazil and Germany. Helios acquired Custom Fluidpower as a wholly owned subsidiary on August 1, 2018. Custom Fluidpower has eight locations throughout Australia where engineering solutions are provided, four of which operate as value-add distributors. The remaining four locations conduct repair work for hydraulics systems.
Until 2016, we operated primarily in the hydraulics market with a small presence in the electronics market. The expansion of our electronic and digital capabilities through the acquisition of Enovation Controls was a significant step towards achieving our Vision 2025 goals. The acquisition further diversified our business, granting us access to the new, highly specialized marine, power generation and recreational vehicle markets and customers seeking complete machine control. Enovation Controls also brought a strong talent pool with a proven track record of new product development and technical innovation, complementing our existing competencies.
We believe our 2018 acquisitions of Faster and Custom Fluidpower are also in alignment with our Vision 2025 goals, advancing the Company as a global technology leader in the industrial goods sector while maintaining superior profitability and financial strength. Faster further diversifies the Company more deeply into the global agriculture market and broadens the Company’s global footprint, advancing our “in the region, for the region” initiative by providing a manufacturing hub in Europe. Custom Fluidpower provides regional value-add capabilities to continue successful penetration of the Asia Pacific (“APAC”) region and particularly Southeast Asia, further evolving our “in the region, for the region” initiative.
We have been profitable every year since 1972 and Sun has paid a dividend every quarter since going public in January 1997.
The Company’s executive offices are located at 1500 West University Parkway, Sarasota, Florida 34243, and our telephone number is (941) 362-1200. Our websites include www.heliostechnologies.com, www.sunhydraulics.com, www.enovationcontrols.com, www.fastercouplings.com and www.custom.com.au.
3
Strategy & Vision 2025
|
|
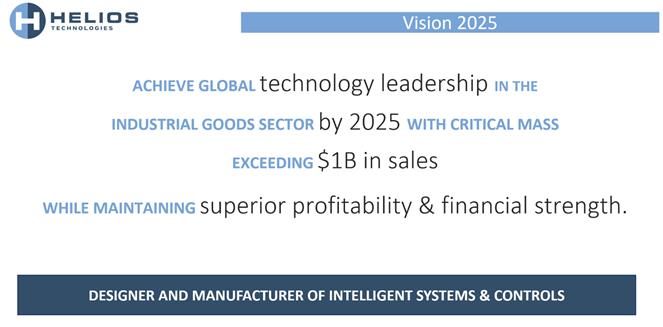
In 2016, we announced our Vision 2025. We believe we can reach a critical mass of $1 billion in annual sales by 2025 while remaining a technology leader in the industrial goods sector. An important aspect of our 2025 vision is that we believe we can maintain superior profitability and financial strength throughout the period of growth. There are two significant components to reaching the revenue goal: organic growth and acquisitions. We expect that, by 2025, up to $930 million of the anticipated annual $1 billion in revenue will result from organic growth of our existing segments (approximately $730 million from our Hydraulics segment and $200 million from our Electronics segment), with the remaining $70 million to be derived from acquisitions of companies that advance our technology position with adjacent products for the industrial goods sector and broaden our geographic reach. We will seek acquisition targets that will bring us advanced technologies in the industrial goods sector. Financially, targets should be accretive in the first year and contribute to maintaining Helios’s superior profitability and financial strength long-term. This is imperative to creating lasting shareholder value. Our current initiatives for organic growth include new product development, penetrating new geographic markets, expanding sales and marketing efforts in existing geographies, developing new channels to market to reach customers not currently in Helios’s purview and further diversifying our end market penetration.
Helios’s strategic roadmap includes product and service differentiation, disciplined and thoughtful leadership throughout our global organization and ensuring that all processes and activities consider the view of the customer. We have identified and have begun applying several tactics to execute our strategies which include capitalizing on our unique and deeply rooted values, structured human capital development and differentiated engineering for both products and processes. Internal key performance indicators are used on a daily basis to align our short-term actions with our long-term strategy.
A primary focus of our strategic thinking is the identification of megatrends which will impact the future capital equipment and industrial goods markets. We have identified three megatrends: globalization, growing sophistication of safe machinery and equipment and increased computing power, as further described below:
Globalization. We believe global population growth and urbanization, driven predominantly by Asian mega-cities, will generate ongoing demand for infrastructure projects, resources and food production, all of which require equipment and machinery from our key end markets.
4
Sophistication of safe machinery and equipment. Machine users increasingly demand safety, productivity, efficiency, and even automated control. Advancements in the design of these machines require continuous evolution of critical components such as hydraulic and electronic functionality and control.
Increased computing power. In the current electronic and digital age, electronics are increasingly used to activate processes which were once activated only manually or mechanically. Information is increasingly being converted into a form that allows it to be processed, stored and transmitted digitally, resulting in both time and energy savings.
Our culture of innovation is at the core of our business. We have approximately 250 engineers in support of product innovation, as well as technical support and customer service. We believe our product innovation will aid organic growth and fill the expected demand resulting from the identified megatrends. All growth initiatives are intended to preserve Helios’s history of superior profitability and financial strength.
Business Segments
Beginning with the fourth quarter of 2016, we are organized into two operating and reporting segments: Hydraulics and Electronics. The Hydraulics segment consists of all of the Sun Hydraulics, Faster and Custom Fluidpower companies globally. The Electronics segment consists of the Enovation Controls business. Financial information about our business segments is presented in Note 17 of the Notes to the Consolidated Financial Statements included in this Annual Report.
Hydraulics
There are three key technologies within our Hydraulics segment: cartridge valve technology (“CVT”), quick-release hydraulic couplings solutions (“QRC”) and hydraulic system design (“Systems”).
Within CVT, our products provide functions important to a hydraulic system: to control rates and direction of fluid flow and to regulate and control pressures. Our CVT products use a fundamentally different design platform compared to most other competitive product offerings, which are often referred to as industry common products. The floating construction that we pioneered results in a self-alignment characteristic that provides performance and reliability advantages compared to most competitors’ product offerings. This floating construction differentiates our products from those of most of our competitors, who design and manufacture rigid screw-in cartridge valves that fit a common cavity. Our cartridge valves, offered in five size ranges and including both electrically actuated and non-electrically actuated products, were designed to be able to operate reliably at higher pressures, making them equally suitable for both industrial and mobile applications. Sun’s product development approach yields a product line of extreme breadth and depth compared to our competitors. Our broad scope of product offerings, coupled with the high-performance characteristics of our cartridge valves, makes Sun a leader in the industry.
QRC products allow users to connect and disconnect quickly from any hydraulic circuit without leakage, and ensure high-performance under high temperature and pressure using one or multiple couplers. Quick connection of multiple hydraulic lines can be accomplished through the use of a MultiFaster or casting solution. Simultaneous connection of several lines is an important feature in many applications and allows for dramatic reduction of connection time, even when the system is under pressure. Faster is a leading global manufacturer of QRC solutions. We design, engineer and distribute hydraulic coupling solutions focused in the agriculture, construction equipment and industrial markets. Exposure to the agriculture market was one of the drivers that led to our acquisition of Faster. This is a key end market for hydraulic applications and Faster’s strong presence in the agriculture market further diversifies Helios’s end market exposures.
5
Systems provide engineered solutions for machine users, manufacturers or designers to fulfill complete system design requirements including electro-hydraulic, remote control, electronic control and programmable logic controller systems, as well as automation of existing equipment. The systems we manufacture are:
|
|
• |
highly efficient, |
|
|
• |
increase and optimize productivity, |
|
|
• |
introduce safer operating procedures, |
|
|
• |
are smaller in size than competitive products, |
|
|
• |
allow for ease of maintenance, and |
|
|
• |
reduce energy costs. |
Sun routinely competes in the custom integrated package market. An integrated package is a customized system solution comprised of multiple cartridge valves assembled in a custom designed manifold for a specific original equipment manufacturers’ (“OEM”) machine. The functionality of the integrated package system is generally specified by the OEM and then designed by Sun or a distributor channel partner.
Custom Fluidpower’s systems provide cost effective alternatives to purchasing new machinery to upgrade, overhaul and automate existing equipment. We also provide full installation and commissioning services for our systems world-wide. Field services are offered for our systems to assist in minimizing downtime, managing breakdowns and routine servicing. Additionally, we offer a comprehensive and fully inclusive asset management program to ensure the ongoing maintenance of the system. We have the ability to manage systems from conception to installation, and provide ongoing maintenance and support.
For many decades, the Hydraulics segment has provided global capital goods industries with innovative product solutions for hydraulic components and systems used to transmit power and control force, speed and motion. Our products typically add a fine degree of precision, reliability and safety to the machinery and equipment in which they are used. Business activities at our global locations include new product development, component and system design, manufacturing, sales, technical support, inventory warehousing and distributor management.
Our hydraulics products are sold globally through a combination of wholly-owned companies, representative sales offices, independent channel partners, which include value-add distributors and integrators, and OEMs. Our global channel partner network includes representation in many industrialized markets.
Hydraulic systems are increasingly taking signals from on-board electronic control systems, making it necessary for hydraulic products to be capable of digital communication. In response to this, in recent years, we have aggressively expanded our CVT offering of electrically-actuated cartridge valves. In 2017, we introduced FLeX™, a new electro-hydraulic product line offering high-performance electro-hydraulic products. Throughout 2018, we continued to introduce new products under the FLeX™ Series, further expanding our electro-hydraulic product offering for both the mobile and industrial hydraulics markets. The valves are designed to outperform comparable valves in the market. They are virtually leak-proof poppet-style valves that deliver consistently better pressure drop. Coil options include interchangeable low-power, high power and hazardous location (explosion-proof) versions for expanded configuration flexibility. The FLeX™ Series valves use Sun’s unique floating-style design, adding an extra layer of security in those harsh applications where torque and force can become excessive.
6
Electronics
In 2016, we acquired Enovation Controls to further develop our digital and electronic capabilities. A portion of the product portfolio offered by Enovation Controls serves end markets also served by our Hydraulics segment such as off-highway vehicles including construction, agricultural and utility vehicles as well as material handling equipment. However, the majority of Enovation’s products are sold into end markets not historically served by our Hydraulics segment such as marine, power generation and recreational vehicles. This provides additional diversification of Helios’s revenue base.
Enovation Controls is a leader in display and control integration solutions offering rugged and reliable instruments, coupled with expertise in J1939 engine protocol, to produce an industry-leading array of easy-to-read displays and gauges for controller area network (“CAN”) transmitted engine data and faults. We refer to this technology as Electronic Controls (“EC”). Our focus is on creating niche products that are customized to the machine in which they are installed in volumes of 1,000 to 10,000 per year. This allows us to target customers or industries that see value in this level of integration, and as a result our customer list contains a wide variety of OEM applications. Product categories include traditional mechanical and electronic gauge instrumentation, plug and go CAN-based instruments, after-market support through global distribution, robust environmentally sealed controllers, hydraulics controllers, engineered panels and application specialists, process monitoring instrumentation, proprietary hardware and software development and wiring harness design and manufacturing.
We offer our customers the ability to customize graphics for our PowerView™ line of LCD displays with focus on the customization of the operator interface: larger, full-graphic displays; flexible hardware configurations; multi-language support; class-leading environmental protection; and software tools that deliver the ultimate solution for OEM and distributor display customization and CAN control. Our displays offer easy-to-read, bonded LCD graphical views with the industry's best readability even in direct sunlight or harsh water conditions. Our controllers are built with the ability to withstand a wide ambient temperature range.
Our panel solutions offer customized design and simple, turnkey solutions. Our Industrial Panel Division offers engineers dedicated to applications, wire harnesses, panels and software development. Engineers focus entirely on custom and standard solutions built to desired specifications. Our services for design and development include on-site installation and testing with reviews to ensure the solution works with the application out of the box.
Through our HCT™ brand, we design and manufacture electronic controllers that manage the function of electrically actuated hydraulic components. HCT™ brand products range from simple one valve, manually adjusted controllers to fully integrated hydraulic control systems managing multiple hydraulic valves as well as other input and output products such as joysticks and displays. All controllers are potted and therefore impervious to outside influence, making them ideal for mobile, industrial and marine applications.
7
Globally, electronics products are sold primarily direct to OEM customers, with about 20% sold through independent, authorized channel partners. Beginning in 2018, we commenced a strategic initiative to further diversify our channels to market as well as our geographic reach. Our expansion efforts will require the development of distribution partners globally, including on-boarding and training of these partners. We feel that these efforts will assist in our ability to diversify our global customer base, allowing us to grow more quickly, diversify the end-markets we serve, and expand our customer base. We have also shifted our focus from an end-market driven sales model to channel-driven sales model. Historically end markets within the Electronics segment were divided into two lines of business: Power Controls (“PC”) and Vehicle Technologies (“VT”). PC served a variety of end markets, including mobile equipment, industrial applications and agriculture with products such as displays, panels, gauges, controllers, battery chargers and various end devices. VT served the recreational end market with products such as electronic controls, displays and instrumentation. Beginning in Q4 2018, Enovation Controls reorganized the management of the business into two distinct sales channels: OEM and Distribution.
Engineering
Engineers play an important role in all aspects of our business including design, manufacturing, sales, marketing and technical support. Engineers work within a disciplined set of design parameters that encourage the re-use and incorporation of existing parts and platforms into new products. Engineers work closely with manufacturing personnel to define the processes required to manufacture products reliably and consistently.
Both of our segments have manufacturing engineers who are responsible for evaluating and changing manufacturing processes as well as implementing lean initiatives throughout global operations.
Hydraulics
Our Hydraulics segment engineers are comprised of three distinct groups: sustaining, innovation/R&D and systems. The sustaining engineering group focuses on improving existing products, both from a design as well as a manufacturing perspective, including optimizing manufacturing costs. The innovation/R&D engineering group is responsible for new product development and evaluating future needs, from a product perspective, of the hydraulics industry. The systems engineering group focuses on system design and component integration to solve the complex needs of a specific application. Additionally, our field application specialists are also engineers who provide local customer interface.
Electronics
In our Electronics segment, approximately one-third of our employees are degreed engineers working across multiple disciplines, including electrical, mechanical, software, sales and application engineering. Our engineering teams:
|
|
• |
focus on hardware design of new products, |
|
|
• |
work with customers to select a group of products to best fit a specific application or machine, |
|
|
• |
create a customized look and feel for the customer interface, and |
|
|
• |
work directly with the customer to arrive at a fully functional and integrated system that meets the customer’s overall electronic control needs. |
Engineering of new products is often very fast paced and is completed in a collaborative manner with each OEM based on a product release date. All engineering groups have significant interface with the customer which enables them to understand market demands and identify opportunities for technological advancement, driving market share gains.
8
New product development generally starts through collaboration with an OEM, driven by the need for innovative products at the machine level. Once products are released and in use by OEMs, a standardized version typically becomes available for sale to distributors as well.
Joint Product Development
There are ongoing joint product development efforts among the engineering groups of Hydraulics and Electronics. Electrification of machines was one of the global needs that will drive the megatrends identified in our strategic review and which led to our acquisition of Enovation Controls. The know-how and technical competence of the engineers in the Electronics segment are being utilized to bring electrification to products and systems designed and manufactured within the Hydraulics segment.
In 2017, we introduced XMD which represents the first joint product development project between our Electronics and Hydraulics business segments. XMD is a compact, Bluetooth® configurable electro-hydraulic driver. XMD is a high-powered, electronic control device for electrically operated hydraulic actuators that is built to stand up to extreme environmental conditions in mobile and industrial applications. The XMD Bluetooth-configurable electro-hydraulic driver meets the needs of international mobile and industrial equipment. The XMD serves actuators used in on- and off-highway equipment in numerous applications including agriculture, forestry, construction, marine, earth moving and material handling. Other joint products are currently in development and are expected to be introduced to the marketplace in the second half of 2019.
These joint development efforts are a key driver of the revenue synergies identified for our acquisitions. We have a small focused group of engineers involved in these development projects to concentrate efforts and drive results. Sun, Faster and Enovation Controls have core competencies within their own technology which must be preserved as it is what powered their historical success. However, we see significant opportunities in bringing together the technology of hydraulics and electronics to create new products which will better serve future market trends.
Manufacturing
Hydraulics
We utilize process-intensive manufacturing operations that make extensive use of automated handling and assembly technology (including robotics), where possible, to perform repetitive tasks, thus promoting manufacturing efficiencies and workplace safety. We employ lean techniques to continually improve our productivity and efficiency. Sun and Faster have complementary manufacturing processes. Sun relies on outside suppliers to perform high-volume machining operations for cartridge parts, but most critical finishing processes are completed in-house. Conversely, Faster completes most of its machining operations in-house and outsources the finishing processes. This provides the Hydraulics segment with an opportunity for Faster to manufacture machined parts for Sun. Faster provides Helios with a manufacturing hub in Europe as we work toward our “in the region, for the region” goal. CFP operates differently than Sun or Faster due to the nature of their business as a value-add distributor. They are focused primarily on systems and service versus pure manufacturing of components. They purchase components from multiple manufactures and utilize them to design and build systems.
We hold significant raw materials, work in process and finished goods in all of the businesses within the Hydraulics segment. The raw materials used, primarily aluminum and steel, are commercially available from multiple sources. Finished goods consist of customer orders which are completed but have not been shipped. We typically build to order, not to stock, so if we produce a part, it will be shipped to a customer on the next available shipping date.
9
In 2018, we negotiated long term agreements (“LTA”) with our key suppliers. Terms and conditions of these agreements include pricing, annual quantity estimates, quality standards, safety stock quantities and lead time expectations. The LTAs are intended to provide the Company and the supplier with a framework for effective long-term planning and utilization of assets.
We continually review all of our suppliers to improve the quality of incoming parts and to assess opportunities for better control of price, quality and lead times. We are in compliance with the following quality systems:
|
|
• |
U.S. ISO 9001:2015 for the design, manufacture, and distribution of high performance screw-in hydraulic cartridge valves and manifolds used to control force, speed and motion in fluid power systems |
|
|
• |
U.S. ISO 9001:2015 for distribution and assembly of quick-disconnect hydraulic and refrigeration couplings |
|
|
• |
U.K. ISO 9001:2015 for the design and manufacture of aluminum and ferrous manifold bodies, hydraulic control valves and cartridge valves |
|
|
• |
Germany ISO 9001:2015 for the design, distribution and manufacturing of hydraulic components for mobile and industrial applications |
|
|
• |
South Korea ISO 9001:2015 and 14001:2015 for the design, development and production of hydraulic valves |
|
|
• |
Italy ISO 9001:2015 for the design and production of hydraulic quick-release couplings and multiconnections for medium and high pressures |
|
|
• |
Italy ISO 14001:2015 for the design and production of hydraulic quick-release couplings and multiconnections for medium and high pressures made by machining and assembling |
Electronics
We offer a wide range of advanced manufacturing and engineering capabilities, including mechanical and electrical hardware design, software design, product testing, in-house LCD bonding, panel and harness engineering and more. State-of-the-art manufacturing capabilities include surface mount technology, x-ray inspection and LCD bonding. Multipoint functional testing is conducted to ensure quality control of our products before they are delivered to our customers. We are a customer/project-based organization, backed by vertically integrated manufacturing capabilities.
A global integrated operating system, which utilizes intelligent approaches like lean manufacturing and six sigma for maximum productivity, allows us to identify and remove variables in our manufacturing and business processes. By pinpointing areas for improvement, we provide our customers with faster delivery time and higher quality products.
Our in-house manufacturing operations feature vertically integrated processes such as wire processing, sheet metal fabrication, LCD bonding, and surface mount technology (“SMT”) printed circuit board assembly. Lean manufacturing designed cells are used for the final assembly of panel, instrument, and electronic products, and cells are networked to a manufacturing execution system (“MES”) database. Products are serialized and functionally tested in process, and test results are recorded by product serial number in the MES database.
We hold significant raw materials and finished goods inventory in our Tulsa, OK facility. Finished goods inventory contains high demand items which require quick delivery. Raw materials inventory generally has significant lead times; therefore, raw material inventory is held to enable us to fulfill orders based on customer request dates which are often less than three weeks.
We continually review all of our suppliers to improve the quality of incoming parts and to assess opportunities for better control of price, quality and lead times. We are in compliance with the following quality systems:
10
|
|
• |
U.S. ISO 9001:2015 for design, manufacture, and sale of rugged instrumentation, panels, displays, and electronic control solutions for engines and engine-driven equipment serving the commercial, industrial and recreational markets |
|
|
• |
U.K. ISO 9001:2015 for the sales, marketing, support and logistics of pressure, temperature, and level instrumentation, as well as battery chargers, power supply units and shock switches. The development and manufacture of battery chargers and power supply units. |
Sales and Marketing
In 2018, no single customer made up more than 5% of consolidated net sales.
Hydraulics
Approximately 75% of Helios’s sales are derived from the Hydraulics segment. Our 2018 Hydraulics segment sales are distributed fairly evenly among our three major geographic regions with 39% to the Americas, 34% to Europe, the Middle East and Africa (“EMEA”) and 27% to APAC. Given our acquisitions in 2018, we have increased our global reach into the EMEA region with Faster, and our APAC presence has significantly grown with Custom Fluidpower.
We market and sell hydraulic products through value-add distributors and directly to OEMs. Globally, approximately 57% of sales are attributed to our channel partners who generally combine our products with other hydraulic components to design a complete hydraulic system. Sales directly to an OEM for integration in their machines makes up the remaining 43%. Sun relies very heavily on its distribution network in the U.S. with nearly 100% of sales in this region going through these channel partners. In EMEA and APAC, CVT sales are split more evenly between OEMs and distribution. Faster sells 75% of its products to global OEMs whereas the remainder of sales utilize worldwide distributors. Technical support is provided by local experts based at each of our global operations.
We provide end users with technical information through the websites of our operating companies and catalogues in multiple languages, including all information necessary to specify and obtain our products. We believe this approach helps stimulate demand for our products.
Electronics
Electronic products are sold globally both to OEM customers and through distributors. OEM sales constitute 80% of total Electronics segment sales. Building strong partnerships with OEMs is a priority. We rely on direct customer contacts to stimulate demand for our products. We work closely with our OEM customers to design and deliver innovative reliable products for specific applications. Twenty-four hour customer service support and an in-house technical service department is available before, during and after the initial sale to create sustainable partnerships with our customers.
In 2018, we moved our sales structure from sales teams that serviced PC and VT end markets to customer-centric sales teams dedicated to OEM and Distributor customer classifications. Our OEM sales team collaborates with large OEMs, whereas the Distributor sales team works with a large number of distributors of varying sizes. The reconfiguration of our sales teams will create a heavier focus on distributor sales with a dedicated team effort. Overall, approximately 20% of segment sales are derived from independent, authorized distributor channel partners.
Geographically, our 2018 Electronics segment sales represent 86% to the Americas, 8% to EMEA and 6% to APAC. There is a well-defined initiative to grow sales in EMEA and APAC as part of Vision 2025. Additionally, synergies identified at the time of acquisition utilize customer relationships from the Hydraulics segment to create pull through of electronic products.
11
Competition
Hydraulics
Competitors in the hydraulics market are broken down into three categories: full-line hydraulics system producers, component only producers of CVT or QRC products, and low-cost producers. Most competitors market globally. Full-line producers can provide complete hydraulic systems to their customers, including component functionally like those manufactured in our Hydraulics segment. Component only producers are like Sun and Faster in that they only offer CVT or QRC products, while additional parts of the hydraulics system are obtained from other manufacturers. Low cost producers are competitors who have emerged in low cost production areas such as Asia and Eastern Europe. These competitors will typically copy both our products and like products designed by competitors. Low cost producers typically have a limited product range compared to full line or cartridge valve only producers which limits their ability to be competitive.
We believe that we compete based upon the quality, reliability, price, value, speed of delivery and technological characteristics of our products and services.
Electronics
Competition within the electronics market is very broad with competitors ranging from large multi-national companies with a full electronics offering to small niche companies that specialize in one product type. Enovation Controls is a niche player in the displays, controllers, gauges and instrumentation panel markets.
The market for products designed and manufactured by Enovation Controls is relatively fragmented with the top four to six companies comprising 70% of the market, mostly servicing the automotive space. Enovation Controls differentiates itself through product quality, customization ability and service with a focus on mid-market niche markets that are not well served by the large competitors.
Our overall position in our key markets is defensible due to high barriers to switching suppliers, such as up-front engineering and programming costs, and positive perceptions among core customers on key selection criteria, including quality and service.
Employees
As of December 29, 2018, we had approximately 2,065 full-time employees with 1,155 in the Americas, 570 in EMEA and 340 in APAC. We believe that relations with our employees are good. Approximately 440 of our employees in Italy are represented by a union. We have constructive and productive dialog on a regular basis with union leaders. To the best of our knowledge, there is no labor dispute, strike, controversy, slowdown, work stoppage or lockout pending or threatened against or affecting the Company, nor is there any basis for any of the foregoing.
Patents and Trademarks
In addition to trade secrets, unpatented know-how, and other intellectual property rights, we own approximately 150 patents and trademarks relating to certain of our products and businesses. We believe that the growth of our business is dependent upon the quality and functional performance of our products and our relationship with the marketplace, rather than on any single patent, trademark, copyright, or other item of intellectual property or group of patents, trademarks or copyrights. However, our patents are important in the defense of our intellectual property from competitors who exploit product development that is not otherwise legally protected by its creator.
12
Available Information
Our annual report on Form 10-K, quarterly reports on Form 10-Q, current reports on Form 8-K, and amendments to those reports, as well as our proxy statements and other materials which are filed with or furnished to the Securities and Exchange Commission (“SEC”) are made available, free of charge, on or through the Helios website under the heading “Investors” and “SEC Filings” as soon as reasonably practicable after they are filed with, or furnished to, the SEC.
13
FACTORS INFLUENCING FUTURE RESULTS - FORWARD-LOOKING STATEMENTS This Annual Report contains “forward-looking statements” (within the meaning of the Private Securities Litigation Reform Act of 1995) that are based on current expectations, estimates, forecasts, and projections, our beliefs, and assumptions made by us, including (i) our strategies regarding growth, including our intention to develop new products and undertake acquisitions; (ii) our financing plans; (iii) trends affecting our financial condition or results of operations; (iv) our ability to continue to control costs and to meet our liquidity and other financing needs; (v) the declaration and payment of dividends; and (vi) our ability to respond to changes in customer demand domestically and internationally, including as a result of standardization. In addition, we may make other written or oral statements, which constitute forward-looking statements, from time to time. Words such as “may,” “expects,” “projects,” “anticipates,” “intends,” “plans,” “believes,” “seeks,” “estimates,” variations of such words, and similar expressions are intended to identify such forward-looking statements. Similarly, statements that describe our future plans, objectives or goals also are forward-looking statements. These statements are not guarantees of future performance and are subject to a number of risks and uncertainties, including those discussed below and elsewhere in this report. Our actual results may differ materially from what is expressed or forecasted in such forward-looking statements, and undue reliance should not be placed on such statements. All forward-looking statements are made as of the date hereof, and we undertake no obligation to update any forward-looking statements, whether as a result of new information, future events or otherwise.
Factors that could cause actual results to differ materially from what is expressed or forecasted in such forward-looking statements include, but are not limited to: (i) conditions in the capital markets, including the interest rate environment and the availability of capital; (ii) changes in the competitive marketplace that could affect our revenue and/or cost bases, such as increased competition, lack of qualified engineering, marketing, management or other personnel, and increased labor and raw materials costs; (iii) new product introductions, product sales mix and the geographic mix of sales nationally and internationally; and (iv) the following risk factors:
Risks Relating to Our Business
General global economic trends and industry trends may affect our sales. The capital goods industry in general, and our businesses, are subject to economic cycles, which directly affect customer orders, lead times and sales volume. Economic downturns generally have a material adverse effect on our business and results of operations, as they did in 2009. Cyclical economic expansions such as those of 2017 and 2018, provide a context where demand for capital goods is stimulated, creating higher incoming order rates for the products we produce. Higher demand can lead to part shortages which drive costs up. If demand gets too strong, lead times can be extended which may cause some customers to cancel orders. In the Electronics segment, our business and widespread adoption of advanced digital control solutions that integrate technologies such as high-resolution displays, configurable software GPS navigation telematics, vehicle management systems, and diagnostics to improve engine safety, energy efficiency, performance, and reliability with less dependence on operator skill, is dependent on the general economy, but also favorable industry trends of the many industries our products serve. If one or more of these expected industry trends fails to occur, or occurs at a slower rate than expected, our sales growth will be negatively impacted, and our business will be adversely affected. In the future, continued weakening or improvement in the economy will directly affect orders and influence results of operations.
14
Our business could be harmed by adverse global and regional economic and political conditions. In June 2016, voters in the United Kingdom approved the United Kingdom’s exit from the European Union (“Brexit”), and the British government has indicated that it intends to negotiate the withdrawal of the United Kingdom from the European Union based on the results of this vote. The Brexit vote has created significant economic uncertainty in the United Kingdom and in Europe, the Middle East, and Asia, which may negatively impact our business results in those regions. In addition, the terms of Brexit, once negotiated, could potentially disrupt the markets we serve and the tax jurisdictions in which we operate and adversely change tax benefits or liabilities in these or other jurisdictions, and may cause us to lose customers, suppliers, and employees. In addition, Brexit could lead to legal uncertainty and potentially divergent national laws and regulations as the United Kingdom determines which European Union laws to replace or replicate. Any of these effects could adversely affect our business and results of operations.
We are subject to intense competition.
Hydraulics
The Hydraulics segment is intensely competitive, and competition comes from many companies, some of which are full-line hydraulic system producers and others that are niche suppliers like us. Full-line producers can provide total hydraulic systems to customers, including components functionally similar to those manufactured by us. We believe that we compete based upon quality, reliability, price, value, speed of delivery and technological characteristics. Many Hydraulics segment competitors are owned by corporations that are significantly larger and have greater financial resources than we have. Also, competitors have emerged in low cost production areas such as Asia and Eastern Europe with look-alike products. We cannot provide assurance that we will continue to be able to compete effectively with these companies.
In addition, we compete in the sale of hydraulic valves, manifolds and integrated packages with certain of our customers, that also may be competitors. Generally, these customers purchase cartridge valves from us to meet a specific need in a system that cannot be filled by any valve they make themselves. To the extent that we introduce new products in the future that increase competition with such customers, it may have an adverse effect on our relationships with them.
Electronics
In the Electronics segment, our products face, and will continue to face, significant competition, including from incumbent technologies. New developments in technology may negatively affect the development or sale of some or all of our products or make our products uncompetitive or obsolete. Other companies, many of which have substantially longer operating histories and larger customer bases, name recognition, and financial and marketing resources than we do, are currently engaged in the development of products and technologies that are similar to, or may compete with, certain of our products and technologies.
We sell products into competitive markets. Within our primary markets, we compete with a range of companies that offer certain individual components of our full system solutions. The components of our overall systems most commonly include displays, panels, sensors, valves, and other end-devices.
15
We also face competition from customers developing products internally. Customers for our products generally have substantial technological capabilities and financial resources. Some customers have traditionally used these resources to develop their own products internally. The future prospects for our products are dependent upon our customers’ acceptance of our products as an alternative to their internally developed products. Future sales prospects also are dependent upon acceptance of third-party sourcing for products as an alternative to in-house development. Customers may in the future continue to use internally developed components. They also may decide to develop or acquire products that are similar to, or that may be substituted for, our products. If our customers fail to accept our products as an alternative, if they develop or acquire the technology to develop such products internally rather than purchase our products, or if we are otherwise unable to develop or maintain strong relationships with them, our business, financial condition and results of operations would be materially and adversely affected.
Competitive actions, such as price reductions, consolidation in the industry, improved delivery and other actions, could adversely affect our revenue and earnings. We could experience a material adverse effect to the extent that our competitors are successful in reducing our customers’ purchases of products and services from us. Competition could also cause us to lower our prices, which could reduce our margins and profitability.
We are subject to risks relating to international sales. International sales represent a significant proportion of our consolidated sales. Approximately 55% and 47% of our net sales were outside of the United States during 2018 and 2017, respectively. We will continue to expand the scope of operations outside the United States, both through direct investment and distribution, and expect that international sales will continue to account for a substantial portion of net sales in future periods.
Our future results could be harmed by a variety of factors, including:
|
|
• |
changes in the political and economic conditions in the countries in which we operate, including civil uprisings and terrorist acts; |
|
|
• |
unexpected changes in regulatory requirements; |
|
|
• |
the imposition of duties and tariffs and other trade barriers; |
|
|
• |
import and export controls; |
|
|
• |
potentially negative consequences from changes in United States and international tax laws; |
|
|
• |
fluctuations in currency exchange rates and the value of the U.S. dollar; |
|
|
• |
exchange controls and currency restrictions; |
|
|
• |
expropriation of property without fair compensation; |
|
|
• |
governmental actions that result in the deprivation of contract or proprietary rights; |
|
|
• |
the acceptance of business practices that are not consistent with or are antithetical to prevailing business practices we are accustomed to in the United States, including bribery and corruption; |
|
|
• |
difficulty in staffing and managing geographically widespread operations; |
|
|
• |
the unionization of, or increased union activity, such as strikes or work stoppages, with respect to, our workforce outside the United States; |
|
|
• |
differing labor regulations; |
|
|
• |
requirements relating to withholding taxes on remittances and other payments by subsidiaries; |
|
|
• |
different regulatory regimes controlling the protection of our intellectual property; |
16
|
|
• |
difficulty in enforcement of contractual obligations under non-U.S. law; |
|
|
• |
refusal or inability of foreign banks to make payment on letters of credit in connection with foreign sales, and our inability to collect from our foreign customers in such circumstances; |
|
|
• |
restrictions on our ability to own or operate subsidiaries, repatriate dividends or earnings from our foreign subsidiaries, or to make investments or acquire new businesses in these jurisdictions; and |
|
|
• |
the burden of complying with multiple and potentially conflicting laws. |
Our international operations and sales also expose us to different local political, regulatory, and business risks and challenges. For example, we are faced with potential difficulties in staffing and managing local operations and we have to design local solutions to manage credit and legal risks of local customers and channel partners, which may not be effective. In addition, because some of our international sales are to suppliers that perform work for foreign governments, we are subject to the political and legal risks associated with foreign government projects. For example, certain foreign governments may require suppliers for a project to obtain products solely from local manufacturers or may prohibit the use of products manufactured in certain countries.
International growth and expansion into markets such as Europe, Asia, and Latin America may cause us difficulty due to greater regulatory barriers than in the United States, the necessity of adapting to new regulatory systems, problems related to entering new markets with different economic, social and political systems and conditions, and significant competition from the primary participants in these markets, some of which may have substantially greater resources and political influence than we do. For example, unstable political conditions or civil unrest could negatively impact our order levels and sales in a region or our ability to collect receivables from customers or operate or execute projects in a region.
Our international operations and transactions also depend upon favorable trade relations between the United States and those foreign countries in which our customers and suppliers have operations. A protectionist trade environment in either the United States or those foreign countries in which we do business or sell products, such as a change in the current tariff structures, export compliance laws, government subsidies, or other trade policies, may adversely affect our ability to sell our products or do business in foreign markets. Our overall success as a global business depends, in part, upon our ability to succeed in differing economic, social, and political conditions. We may not succeed in developing and implementing policies and strategies to counter the foregoing factors effectively in each location where we do business, and the foregoing factors may cause a reduction in our sales, profitability, or cash flows, or cause an increase in our liabilities.
17
Failure to comply with laws, regulations and policies, including the U.S. Foreign Corrupt Practices Act or other applicable anti-corruption legislation, could result in fines, criminal penalties and an adverse effect on our business. We are subject to regulation under a wide variety of U.S. federal and state and non-U.S. laws, regulations and policies, including anti-corruption laws and export-import compliance and trade laws, due to our global operations. In particular, the U.S. Foreign Corrupt Practices Act, or FCPA, the U.K. Bribery Act of 2010 and similar anti-bribery laws in other jurisdictions generally prohibit companies, their agents, consultants and other business partners from making improper payments to government officials or other persons (i.e., commercial bribery) for the purpose of obtaining or retaining business or other improper advantage. They also impose recordkeeping and internal control provisions on companies such as ours. We operate and/or conduct business, and any acquisition target may operate and/or conduct business, in some parts of the world, such as China, India and Russia, that are recognized as having governmental and commercial corruption and in such countries, strict compliance with anti-bribery laws may conflict with local customs and practices. Under some circumstances, a parent company may be civilly and criminally liable for bribes paid by a subsidiary. We cannot provide assurance that our or any acquisition target’s internal control policies and procedures have protected us, or will protect us, from unlawful conduct of our employees, agents, consultants and other business partners. In the event that we believe or have reason to believe that violations may have occurred, including without limitation violations of anti-corruption laws, we may be required to investigate and/or have outside counsel investigate the relevant facts and circumstances, which can be expensive and require significant time and attention from senior management. Violation may result in substantial civil and/or criminal fines, disgorgement of profits, sanctions and penalties, debarment from future work with governments, curtailment of operations in certain jurisdictions, and imprisonment of the individuals involved. As a result, any such violations may materially and adversely affect our business, results of operations or financial condition. In addition, actual or alleged violations could damage our reputation and ability to do business. Any of these impacts could have a material, adverse effect on our business, results of operations or financial condition.
Fluctuations in exchange rates may affect our operating results and impact our financial condition. Fluctuations in the value of the U.S. dollar may increase or decrease our sales or earnings. Because our consolidated financial results are reported in U.S. dollars, when we generate sales or earnings in other currencies, or we pay expenses in other currencies, the translation of those results into U.S. dollars can result in a significant increase or decrease in the amount of those sales or earnings. If the U.S. dollar strengthens relative to the value of the local currency, we may be less competitive. In addition, our debt service requirements are predominantly in U.S. dollars and a portion of our cash flow is generated in British pounds, euros and other foreign currencies. Significant changes in the value of the foreign currencies relative to the U.S. dollar could impair our cash flow, results of operations, and financial condition.
In addition, fluctuations in currencies relative to the U.S. dollar may make it more difficult to perform period-to-period comparisons of our reported results of operations. For purposes of accounting, the assets and liabilities of our foreign operations, where the local currency is the functional currency, are translated using period-end exchange rates, and the revenues and expenses of our foreign operations are translated using average exchange rates during each period.
In addition to currency translation risks, we incur currency transaction risk whenever we enter into either a purchase or a sales transaction using a currency other than U.S. dollars. Given the volatility of exchange rates, we may not be able to effectively manage our currency or translation risks. Volatility in currency exchange rates may decrease our sales and profitability and impair our financial condition. We periodically evaluate our need to hedge our exposures to foreign currencies and enter into forward foreign exchange contracts as we deem necessary.
18
Our existing indebtedness could adversely affect our business and growth prospects. As of December 29, 2018, we had total indebtedness (including the current portion) of approximately $353 million. Our indebtedness, or any additional indebtedness we may incur, could require us to divert funds identified for other purposes for debt service and impair our liquidity position. If we cannot generate sufficient cash flow from operations to service our debt, we may need to refinance our debt, dispose of assets or issue equity to obtain necessary funds. We do not know whether we would be able to take any of these actions on a timely basis, on terms satisfactory to us or at all.
Our indebtedness, the cash flow needed to satisfy our debt and the covenants contained in our senior credit facility have important consequences, including:
|
|
• |
limiting funds otherwise available for financing our capital expenditures by requiring us to dedicate a portion of our cash flows from operations to the repayment of debt and the interest on this debt; |
|
|
• |
limiting our ability to incur additional indebtedness; |
|
|
• |
limiting our ability to capitalize on significant business opportunities; |
|
|
• |
placing us at a competitive disadvantage to those of our competitors that are less indebted than we are; |
|
|
• |
making us more vulnerable to rising interest rates; and |
|
|
• |
making us more vulnerable in the event of a downturn in our business. |
More specifically, under the terms of our senior credit facility, we have agreed to certain financial covenants. In addition, our senior credit facility places limitations on our ability to acquire other companies. Any failure by us to comply with the financial or other covenants set forth in our senior credit facility in the future, if not cured or waived, could result in our senior lender accelerating the maturity of our indebtedness or preventing us from accessing availability under our senior credit facility. If the maturity of our indebtedness is accelerated, we may not have sufficient cash resources to satisfy our debt obligations and we may not be able to continue our operations as planned.
We may need additional capital in the future, and it may not be available on acceptable terms, or at all. We may require additional capital in the future to:
|
|
• |
fund our operations; |
|
|
• |
finance investments in equipment and infrastructure needed to maintain and expand our manufacturing and distribution capabilities; |
|
|
• |
enhance and expand the range of products we offer; and |
|
|
• |
respond to potential strategic opportunities, such as investments, acquisitions, and international expansion. |
We can give no assurance that additional financing will be available on terms favorable to us, or at all. The terms of available financing may place limits on our financial and operating flexibility. If adequate funds are not available on acceptable terms, we may be forced to reduce our operations or to delay, limit or abandon expansion opportunities. Moreover, even if we are able to continue our operations, the failure to obtain additional financing could reduce our competitiveness. Our senior credit facility limits our ability to incur additional debt and therefore we likely would have to issue additional equity to raise additional capital. If we issue additional equity, your interest in us will be diluted.
19
We are subject to various risks relating to our growth strategy. In pursuing our growth strategy and Vision 2025, we intend to expand our presence in existing markets, enter new markets, and pursue acquisitions and joint ventures to complement our business. Many of the expenses arising from expansion efforts may have a negative effect on operating results until such time, if at all, that these expenses are offset by increased revenues. We cannot assure you that we will be able to improve our market share or profitability, recover our expenditures, or successfully implement our growth strategy.
The expansion strategy also may require substantial capital investment for the construction of new facilities and their effective operation. We can give no assurance that additional financing will be available on terms favorable to us, or at all.
Our culture, by encouraging initiative, and both individual and collaborative responsibility, has substantially contributed to our success and operating results. Because our employees are able to readily shift their job functions to accommodate the demands of the business and changes in the market, we are a nimble, creative and innovative organization. As we increase the number of our employees and grow into new geographic markets, our culture will likely shift and evolve in new ways. Because our culture promotes the drivers of our success, our inability to protect and align our core values and culture with the evolving needs of the business could adversely affect our continued success.
We may fail to successfully acquire or integrate companies that provide complementary products or technologies. A key component of our growth strategy and Vision 2025 depends upon our ability to successfully identify and integrate acquisition targets that complement our existing products and services. Such a strategy involves the potential risks inherent in assessing the value, strengths, weaknesses, contingent or other liabilities, and potential profitability of acquisition candidates and in integrating the operations of acquired companies, including Faster and Custom Fluidpower. In addition, any acquisitions of businesses with foreign operations or sales may increase our exposure to risks inherent in doing business outside the United States. From time to time, we may have acquisition discussions with potential target companies both domestically and internationally. Any acquisition may or may not occur and, if an acquisition does occur, it may not be successful in enhancing our business for one or more of the following reasons:
|
|
• |
Any business acquired may not be integrated successfully and may not prove profitable; |
|
|
• |
The price we pay for any business acquired may overstate the value of that business or otherwise be too high; |
|
|
• |
Liabilities we take on through the acquisition may prove to be higher than we expected; |
|
|
• |
Impairment of relationships with employees and customers of the business acquired as a result of the change in ownership; |
|
|
• |
We may fail to achieve acquisition synergies; or |
|
|
• |
The focus on the integration of operations of acquired entities may divert management’s attention from the day-to-day operation of our businesses. |
Inherent in any future acquisition is the risk of transitioning company cultures and facilities. The failure to efficiently and effectively achieve such transitions could increase our costs and decrease our profitability.
We also may incur significant costs such as transaction fees, professional service fees, and other costs related to future acquisitions, as well as integration costs following the completion of any such acquisitions. Although we expect that the realization of efficiencies related to the integration of any acquired businesses will offset the incremental transaction and acquisition-related costs over time, this net financial benefit may not be achieved in the near term, or at all.
20
If we are unable to continue our technological innovation and successful introduction of new commercial products, our business will be adversely affected. The industries we serve in the Electronics segment experience ongoing technological change and product improvement. Manufacturers periodically introduce new generations of products or require new technological capacity to develop customized products or to respond to industry developments or needs. Our future growth will depend on our ability to gauge the direction of the commercial and technological progress in our markets, as well as our ability to acquire new product technologies or to fund and successfully develop, manufacture and market products in this constantly changing environment. We must continue to identify, develop, manufacture and market innovative products on a timely basis to replace existing products in order to maintain our profit margins and competitive position. We may not be successful in acquiring and developing new products or technologies and any of our new products may not be accepted by our customers. If we fail to keep pace with evolving technological innovations in the markets we serve, our business will be adversely affected. Technology does not advance as quickly in the Hydraulics segment and, therefore, when there is risk relative to continued technological innovation, there is a lower threat than in the Electronics segment.
Our product development activities may not be successful, may be more costly than currently anticipated, or we may not be able to produce newly developed products at a competitive cost. Our business involves a significant level of product development activities, generally in connection with our customers’ development activities. Industry standards, customer expectations, or other products may emerge that could render one or more of our products or services less desirable or obsolete. Maintaining our market position requires continued investment in research and development. During an economic downturn or a subsequent recovery, we may need to maintain our investment in research and development, which may limit our ability to reduce these expenses in proportion to a sales shortfall. In addition, increased investments in research and development may divert resources from other potential investments in our business, such as acquisitions or investments in our facilities, processes and operations. If these activities are not as successful as currently anticipated, are not completed on a timely basis, or are more costly than currently anticipated, or if we are not able to produce newly developed products at a cost that meets the anticipated product cost structure, then our future sales, margins and/or earnings could be lower than expected, which could have a material adverse effect on our business, financial condition, results of operations, and cash flows.
21
If we are unable to protect the confidentiality of our trade secrets, our business and competitive position would be harmed. In the Electronics segment particularly, we rely significantly on trade secrets, including unpatented software algorithms, know-how, technology, and other proprietary information, to maintain our competitive position. We seek to protect software algorithms through encryption mechanisms in the distribution of our binary files used in programming our engine control products. However, we cannot guarantee that these encryption techniques can protect all or any portion of these binary files. In practice, we seek to protect our trade secrets by entering into non-disclosure and confidentiality agreements with parties who have access to them, such as our employees, corporate collaborators, outside scientific collaborators, contract manufacturers, consultants, advisors and other third parties. In practice, we also enter into confidentiality and noncompetition agreements with certain of our employees and consultants that obligate them to assign to us any inventions developed in the course of their work for us. However, we cannot guarantee that we have executed these agreements with each party that may have or has had access to our trade secrets or that the agreements we have executed will provide adequate protection. Despite these efforts, any of these parties may breach the agreements and disclose our proprietary information, including our trade secrets, and we may not be able to obtain adequate remedies for such breaches. As a result, we may be forced to bring claims against third parties, or defend claims that they bring against us, to determine ownership of what we regard as our intellectual property. Monitoring unauthorized disclosure is difficult and we do not know whether the procedures we have followed to prevent such disclosure are, or will be, adequate. Enforcing a claim that a party illegally disclosed or misappropriated a trade secret is difficult, expensive and time-consuming, and the outcome is unpredictable. In addition, some courts inside and outside the United States may be less willing or unwilling to protect trade secrets. If any of our trade secrets were to be disclosed to, or independently developed by, a competitor, our competitive position would be harmed, which could have an adverse effect on our business and financial condition.
The inability to protect our intellectual property could reduce or eliminate any competitive advantage and reduce our sales and profitability, and the cost of protecting our intellectual property may be significant. We have obtained and applied for some U.S. and foreign trademark and patent registrations and will continue to evaluate the registration of additional trademarks and patents, as appropriate. We cannot guarantee that any of our pending patent and trademark applications will be approved. Moreover, even if the applications are approved, third parties may seek to oppose or otherwise challenge them. An inability to obtain registrations in the United States or elsewhere could limit our ability to protect our trademarks and technologies and could impede our business. Further, the protection of our intellectual property rights may require expensive investment in protracted litigation and substantial management time, and there is no assurance we ultimately would prevail or that a successful outcome would lead to an economic benefit that is greater than the investment in the litigation. In the Electronics segment, the key issued patents in our patent portfolio are scheduled to expire between 2023 and 2033. In the Hydraulics segment, the key issued patents in our patent portfolio are schedule to expire between 2020 and 2039.
We may also face difficulties protecting our intellectual property rights in foreign countries. The laws of foreign countries in which our products are sold or manufactured may not protect our intellectual property rights to the same extent as the laws of the United States. For example, we are increasing our technical capabilities and sales in China, where laws may not afford the same intellectual property protections.
22
Our use of open source software may expose us to additional risks. In the Electronics segment particularly, we use open source software in our business, including in some of our products. While we try to monitor all use of open source software in our business to ensure that no open source software is used in such a way as to require us to disclose the source code to critical or fundamental elements of our software or technology, we cannot be certain that such use may not have inadvertently occurred in deploying our solutions. Furthermore, the terms of many open source licenses have not been interpreted by U.S. courts. As a result, there is a risk that these licenses could be construed in a way that could impose unanticipated conditions or restrictions on our ability to commercialize our products. The risks associated with usage of open source software cannot be eliminated and could potentially have a material adverse effect on our business, financial condition, and results of operations.
If we are alleged to have infringed upon the intellectual property rights owned by others, our business and results of operations could be materially adversely affected. In the Electronics segment, competitors or other third parties may allege that we, or consultants or other third parties retained or indemnified by us, infringe on their intellectual property rights. We also may face allegations that our employees have misappropriated intellectual property rights of their former employers or other third parties. From time to time, we receive notices from other companies that allege we may be infringing certain of their patents or other rights. If we are unable to resolve these matters satisfactorily, or to obtain licenses on acceptable terms, we may face litigation. Given the potential risks and uncertainties of intellectual property-related litigation, the assertion of an infringement claim against us may cause us to spend significant amounts to defend the claim (even if we ultimately prevail), pay significant money damages, lose significant revenues, be prohibited from using the relevant technologies or other intellectual property rights, cease offering certain products or services, or incur significant license, royalty, or technology development expenses. Even in instances where we believe that claims and allegations of intellectual property infringement against us are without merit, defending against such claims is time consuming and expensive and could result in the diversion of time and attention of our management and employees. In addition, although in some cases a third party may have agreed to indemnify us for such costs, such indemnifying party may refuse or be unable to uphold its contractual obligations.
We are dependent upon key employees and skilled personnel. Our success depends, to some extent, upon a number of key individuals. The loss of the services of one or more of these individuals could have a material adverse effect on our business. Future operating results depend to a significant degree upon the continued contribution of key management, technical personnel and the skilled labor force. As the Company continues to expand internationally, additional management and other key personnel will be needed. Competition for management and engineering personnel is intense, and other employers may have greater financial and other resources to attract and retain these employees. We conduct a substantial part of our operations in Sarasota, Florida, Tulsa, Oklahoma and Rivolta D’adda, Italy. Our continued success is dependent on our ability to attract and retain a skilled labor force at these locations. There are no assurances that we will continue to be successful in attracting and retaining the personnel required to develop, manufacture and market our products and expand our operations.
23
We are subject to fluctuations in the prices of parts and raw materials, and dependent on our suppliers of these parts. We are dependent upon suppliers for parts and raw materials used in the manufacture of components that we sell to our customers, and some of our raw material costs are subject to commodity market price fluctuations. We may experience an increase in costs for parts or raw materials that we source from our suppliers, or we may experience a shortage of parts or raw materials for various reasons, such as the loss of a significant supplier, high overall demand creating shortages in parts and supplies we use, financial distress, work stoppages, natural disasters, fluctuations in commodity prices, or production difficulties that may affect one or more of our suppliers. In particular, current or future global economic uncertainty may affect our key suppliers in terms of their operating cash flow and access to financing. This may, in turn, affect their ability to perform their obligations to us. In addition, quality and sourcing issues that our suppliers may experience can also adversely affect the quality and effectiveness of our products and services and may result in liability or reputational harm to us. Our customers rely on us to provide on-time delivery and have certain rights if our delivery standards are not maintained. A significant increase in our supply costs, including for raw materials that are subject to commodity price fluctuations, or a protracted interruption of supplies for any reason, could result in the delay of one or more of our customer contracts, or could damage our reputation and relationships with our customers. Any of these events could have a material adverse effect on our business, financial condition, results of operations, and cash flows.
Some of our products contain magnets that use rare earth metals, and unavailability or limited supply of these metals could delay production of our products or increase our production costs. In the Electronics segment, some of our products contain magnets that use rare earth metals sourced from China. Although such rare earth metals are available from other sources, these alternative sources may be more costly. Reduced availability of such rare earth metals from China through additional export regulations or restrictions, export quotas, tariffs, or for other reasons could impact our ability to obtain magnets that use the required rare earth metals in sufficient quantities, in a timely manner, or at a commercially reasonable cost. In the event that China’s actions cause our suppliers to seek alternate sources of supply for rare earth metals, it could cause a delay in the production of our products that contain magnets using rare earth metals and increase the cost to us of such magnets, thereby reducing or eliminating our profit margin on certain of our products if we are unable to pass the increase in our production costs on to our customers. Increasing prices to our customers due to escalating costs of rare earth metals may reduce demand for our products and negatively affect our results of operations.
Increased IT security threats and more sophisticated and targeted computer crime could pose a risk to our systems, networks, products, solutions and services. We are dependent on various information technologies throughout our Company to administer, store and support multiple business activities. Increased global IT security threats and more sophisticated and targeted computer crime pose a risk to the security of our systems and networks and the confidentiality, availability and integrity of our data. While we attempt to mitigate these risks by employing a number of measures, including employee training, comprehensive monitoring of our networks and systems, and maintenance of backup and protective systems, our systems, networks, products, solutions, and services remain potentially vulnerable to advanced persistent threats. Depending on their nature and scope, such threats could potentially lead to the compromising of confidential information, improper use of our systems and networks, manipulation and destruction of data, defective products, production downtimes, and operational disruptions, which in turn could adversely affect our reputation, competitiveness, and results of operations.
24
Unforeseen or recurring operational problems at any of our facilities, or other catastrophic loss of one of our key manufacturing facilities, may cause significant lost production and adversely affect our results of operations. Our manufacturing process could be affected by operational problems that could impair our production capability. Many of our manufacturing facilities contain high cost and sophisticated machines that are used in our manufacturing processes. Disruptions or shut downs at any of our facilities could be caused by:
|
|
• |
maintenance outages to conduct maintenance activities that cannot be performed safely during operations; |
|
|
• |
prolonged power failures or reductions; |
|
|
• |
breakdown, failure or substandard performance of any of our machines or other equipment; |
|
|
• |
noncompliance with, and liabilities related to, environmental requirements or permits; |
|
|
• |
disruptions in the transportation infrastructure, including railroad tracks, bridges, tunnels or roads; |
|
|
• |
fires, floods, earthquakes, tornadoes, hurricanes, microbursts or other catastrophic disasters, national emergencies, political unrest, war or terrorist activities; or |
|
|
• |
other operational problems. |
If some of our facilities are shut down, they may experience prolonged startup periods, regardless of the reason for the shutdown. Those startup periods could range from several days to several weeks or longer, depending on the reason for the shutdown and other factors. Any prolonged disruption in operations at any of our facilities could cause a significant loss of production and adversely affect our results of operations and negatively impact our customers and dealers.
We currently have operations located in geographies susceptible to severe weather events, such as hurricanes floods, earthquakes and tornadoes. A catastrophic event, whether resulting from severe weather or otherwise, could result in the loss of the use of all or a portion of one of our manufacturing facilities. Although we carry property and business interruption insurance, our coverage may not be adequate to compensate us for all losses that may occur. Any of these events individually or in the aggregate could have a material adverse effect on our business, financial condition and operating results.
We are subject to risks relating to changes in our tax rates, unfavorable resolution of tax contingencies, or exposure to additional income tax liabilities. We are subject to income taxes in the United States and various non-U.S. jurisdictions. Domestic and international tax liabilities are subject to the allocation of income among various tax jurisdictions. Our effective tax rate could be affected by changes in the mix among earnings in countries with differing statutory tax rates or changes in tax laws. We are subject to on-going tax audits in various jurisdictions. If these audits result in assessments different from amounts reserved, future financial results may include unfavorable adjustments to our tax liabilities, which could have a material adverse effect on our results of operations.
U.S. federal income tax reform could adversely affect us and our shareholders. On December 22, 2017, the Tax Cuts and Jobs Act (“TCJA”) was signed into law. The TCJA significantly reforms the Internal Revenue Code of 1986, as amended, or the Code. The TCJA, among other things, includes changes to U.S. federal tax rates, imposes significant additional limitations on the deductibility of interest, allows for the expensing of capital expenditures, and puts into effect the migration from a “worldwide” system of taxation to a territorial system. Our net deferred tax assets and liabilities have been revalued at the newly-enacted U.S. corporate rate, and the impact was recognized in our tax expense for the 2017 year. As the United States Department of Treasury and the IRS continue to issue regulations interpreting the implications of the TCJA, we continue to examine the impact that this tax reform legislation may have on our business. The impact of this tax reform on holders of our common stock is uncertain and could be adverse. We urge our shareholders to consult with their legal and tax advisors with respect to such legislation and the potential tax consequences of investing in our common stock.
25
Our operations are subject to environmental, health and safety laws and regulations, and we may face significant costs or liabilities associated with environmental, health and safety matters. We are subject to a variety of federal, state, local and foreign environmental, health, and safety laws and regulations concerning, among other things, the discharge of pollutants into the soil, air, and water, the generation, storage, handling, use, release, disposal and transportation of hazardous materials and wastes, environmental cleanup, and the health and safety of our employees. Environmental, health, and safety laws and regulations continue to evolve, and we may become subject to increasingly stringent environmental standards in the future, particularly related to air quality and water quality, which could require us to make changes to our operations or incur significant costs relating to compliance. We are also required to obtain and maintain environmental, health and safety permits and approvals for our facilities and operations. Our failure to comply with such laws, regulations, permits and approvals could subject us to increased employee healthcare and workers’ compensation costs, liabilities, fines and other penalties or compliance costs, and could have a material adverse effect on our business, financial condition and results of operations.
Our business is subject to a variety of governmental regulations that may restrict our business and may result in costs and penalties. We are subject to a variety of federal, state, and local laws and regulations relating to foreign business practices, labor and employment, construction, land use, and taxation, among others. These laws and regulations are complex, change frequently and have tended to become more stringent over time. Failure to comply with these laws and regulations may result in a variety of administrative, civil and criminal enforcement measures, including assessment of monetary penalties and the imposition of corrective requirements. From time to time, as part of the regular overall evaluation of our operations, including newly acquired operations, we may be subject to compliance audits by regulatory authorities. In addition, any failure to comply with regulations related to the government procurement process at the federal, state, or local level or restrictions on political activities and lobbying may result in administrative or financial penalties including being barred from providing services to governmental entities, which could have a material adverse effect on our results of operations.
Our operations expose us to risks of non-compliance with numerous countries’ import and export laws and regulations. Due to our significant foreign sales, we are subject to trade and import and export regulations in multiple jurisdictions, including the U.S. Treasury Department’s Office of Foreign Assets Control’s regulations. As a result, compliance with multiple trade sanctions and embargoes and import and export laws and regulations pose a constant challenge and risk to us. Furthermore, the laws and regulations concerning import activity, export recordkeeping and reporting, export control and economic sanctions are complex and constantly changing. Any failure to comply with applicable legal and regulatory trading obligations could result in criminal and civil penalties and sanctions, such as fines, imprisonment, debarment from governmental contracts, seizure of shipments, loss of import and export privileges, reputational damage, and a reduction in the value of our common stock.
26
Regulations related to “conflict minerals” may force us to incur additional expenses and may result in damage to our reputation. We are subject to the Securities and Exchange Commission’s regulations applicable to companies that use certain minerals, known as conflict minerals, in their products or in the production of their products, whether or not these products are manufactured by third parties. These requirements require us to conduct an inquiry into the country of origin of the conflict minerals used, and if it is determined that the conflict minerals used may have originated in the Democratic Republic of Congo or other covered countries, conduct due diligence on the source and chain of custody of the conflict minerals. These requirements could adversely affect the sourcing, availability and pricing of minerals used in the manufacture of our products. In addition, we incur additional costs to comply with the disclosure requirements, including costs related to determining the source of any of the relevant minerals and metals used in our products or in the manufacturing process. Since our supply chain is complex, we may not be able to sufficiently verify the origins for these minerals and metals used in our products through the due diligence procedures that we implement, which may harm our reputation. In such event, we may also face difficulties in satisfying customers who require that all of the components of our products be conflict mineral free.
Due to the nature of our business and products, we may be liable for damages based on product liability, other tort, and warranty claims. We face an inherent risk of exposure to claims in the event that the failure, use or misuse of our products results, or is alleged to result, in death, bodily injury, property damage, or economic loss. In the past we have been subject to product liability claims relating to our products, and we may be subject to additional product liability claims in the future for both past and current products.
Although we currently maintain product liability coverage, which we believe to be adequate for the continued operation of our business, such insurance may become difficult or impossible to obtain in the future on terms acceptable to us. Moreover, our insurance coverage includes customary exclusions and conditions, may not cover certain specialized applications, and generally does not cover warranty or recall claims. A successful product liability claim or series of claims against us, including one or more consumer claims purporting to constitute class actions or claims resulting from extraordinary loss events, in excess of or outside our insurance coverage, or a significant warranty claim or series of claims against us, could materially decrease our liquidity, impair our financial condition and adversely affect our results of operations. Furthermore, regardless of the outcome, product liability claims can be expensive to defend, can divert the attention of management and other personnel for significant periods of time, and can cause reputational damage.
Risks Relating to Our Common Stock
Future sales of our common stock in the public market or the issuance of securities senior to our common stock could adversely affect the trading price of our common stock and our ability to raise funds in new stock offerings. Sales by us or our shareholders of a substantial number of shares of our common stock in the public markets, or the perception that these sales might occur, could cause the market price of our common stock to decline or could impair our ability to raise capital through a future sale of, or pay for acquisitions using, our equity securities.
We may issue common stock or equity securities senior to our common stock in the future for a number of reasons, including to finance our operations and business strategy, as consideration in acquisitions or for other reasons. We cannot predict the effect, if any, that future sales or issuances of shares of our common stock or other equity securities, or the availability of shares of our common stock or any other equity securities for future sale or issuance, will have on the trading price of our common stock.
27
The price of our common stock may fluctuate significantly, which could negatively affect us and holders of our common stock. The trading price of our common stock may fluctuate significantly in response to a number of factors, many of which are beyond our control. For instance, if our financial results are below the expectations of securities analysts and investors, the market price of our common stock could decrease, perhaps significantly. Other factors that may affect the market price of our common stock include announcements relating to significant corporate transactions; operating and stock price performance of companies that investors deem comparable to us; future sales by us or our subsidiaries of equity, equity-related or debt securities; the amount, if any, of dividends that we pay on our common stock; anticipated or pending investigations, proceedings or litigation that involve or affect us; changes in regional, national or global financial markets and economies and general market conditions, such as interest or foreign exchange rates, stock, commodity, credit or asset valuations or volatility; and changes in government regulation or proposals relating to us. In addition, the U.S. and global securities markets have experienced significant price and volume fluctuations. These fluctuations often have been unrelated to the operating performance of companies in these markets. Market fluctuations and broad market, economic and industry factors may negatively affect the price of our common stock, regardless of our operating performance. You may not be able to sell your shares of our common stock. Any volatility of or a significant decrease in the market price of our common stock could also negatively affect our ability to make acquisitions using our common stock.
Additional issuances of equity securities would dilute the ownership of existing shareholders and could reduce our earnings per share. We may issue equity securities in the future in connection with capital raising activities, acquisitions, strategic transactions or for other purposes. To the extent we issue additional equity securities, the ownership of our existing shareholders would be diluted and our earnings per share could be reduced.
Provisions in our amended and restated articles of incorporation and amended and restated bylaws, as well as certain provisions of Florida law, may discourage a takeover attempt. Provisions contained in our amended and restated articles of incorporation and amended and restated bylaws, as well as certain provisions of Florida law, could make it more difficult for a third party to acquire us, even if doing so might be beneficial to our shareholders. Provisions of our amended and restated articles of incorporation and amended and restated bylaws impose various procedural and other requirements which could make it more difficult for shareholders to effect certain corporate actions. For example, our amended and restated articles of incorporation authorizes our board of directors to determine the rights, preferences, privileges and restrictions of unissued series of preferred stock, without any vote or action by our shareholders. Thus, our board of directors can authorize and issue shares of preferred stock with voting or conversion rights that could adversely affect the voting or other rights of holders of our common stock. In addition, a change of control of our Company may be delayed or deterred as a result of our having three classes of directors serving staggered three-year terms. These provisions could limit the price that certain investors might be willing to pay in the future for shares of our common stock.
We may be subject to influence by certain shareholders and management. Christine L. Koski, the daughter of the deceased founder of the Company, Robert E. Koski, is a member of the board of directors. She, along with other family members, own or control approximately 9% of the outstanding shares of our common stock. Accordingly, the members of the Koski family may have some ability to influence the election of our directors and the outcome of certain corporate actions requiring shareholder approval. Such influence could preclude any acquisition of the Company and could adversely affect the price of our common stock. Our directors and executive officers as a group beneficially own or control approximately 6% of the outstanding shares of our common stock.
28
We may not pay dividends on our common stock. Holders of our common stock are only entitled to receive such dividends as our board of directors may declare out of funds legally available for such payments and as permitted by our debt agreements. Although historically we have paid a continuous quarterly dividend and a periodic special dividend, we are not required to declare cash dividends on our common stock and the payment of future quarterly and special dividends is subject to the discretion of our board of directors. In determining the amount of any future quarterly or special dividends, our board of directors will consider economic and market conditions, our financial condition and operating results. Any change in our historical dividend practice could adversely affect the market price of our common stock. If our board of directors decides not to pay dividends in the future, then a return on your investment in our common stock will only occur if our stock price appreciates.
Securities analysts may issue negative reports or cease to cover our common stock, which may have a negative impact on the market price of our common stock. The trading market for our common stock may be affected in part by the research and reports that industry or financial analysts publish about us or our business. If one or more of the analysts who elects to cover us downgrades our stock, then our stock price would likely decline rapidly. If one or more of these analysts ceases coverage of Helios, we could lose visibility in the market, which in turn could cause our stock price to decline. This could have a negative effect on the market price of our common stock.
29
ITEM 1B. UNRESOLVED STAFF COMMENTS
None.
Corporate Office
We lease office space in Sarasota, FL that is used as our corporate headquarters.
Segments
The table below presents information on the primary operating facilities in our Hydraulics and Electronics segments. These locations are generally used for manufacturing and distribution activities as well as sales, engineering and administrative functions.
|
Hydraulics Segment |
|
||||||||||||||
|
|
Number of |
|
|
Square Footage (in thousands) |
|
||||||||||
|
Country |
Locations |
|
|
Owned |
|
|
Leased |
|
|
Total |
|
||||
|
Australia |
|
8 |
|
|
|
7 |
|
|
|
28 |
|
|
|
35 |
|
|
China |
|
1 |
|
|
|
— |
|
|
|
12 |
|
|
|
12 |
|
|
Germany |
|
1 |
|
|
|
54 |
|
|
|
— |
|
|
|
54 |
|
|
India |
|
1 |
|
|
|
— |
|
|
|
41 |
|
|
|
41 |
|
|
Italy |
|
1 |
|
|
|
— |
|
|
|
232 |
|
|
|
232 |
|
|
South Korea |
|
1 |
|
|
|
11 |
|
|
|
— |
|
|
|
11 |
|
|
United Kingdom |
|
1 |
|
|
|
37 |
|
|
|
— |
|
|
|
37 |
|
|
United States |
|
2 |
|
|
|
223 |
|
|
|
56 |
|
|
|
279 |
|
|
Total |
|
16 |
|
|
|
332 |
|
|
|
369 |
|
|
|
701 |
|
|
|
|
|
|
|
|
|
|
|
|
|
|
|
|
|
|
|
Electronics Segment |
|
||||||||||||||
|
|
Number of |
|
|
Square Footage (in thousands) |
|
||||||||||
|
Country |
Locations |
|
|
Owned |
|
|
Leased |
|
|
Total |
|
||||
|
China |
|
1 |
|
|
|
— |
|
|
|
9 |
|
|
|
9 |
|
|
United Kingdom |
|
1 |
|
|
|
18 |
|
|
|
— |
|
|
|
18 |
|
|
United States |
|
2 |
|
|
|
179 |
|
|
|
6 |
|
|
|
185 |
|
|
|
|
4 |
|
|
|
197 |
|
|
|
15 |
|
|
|
212 |
|
In addition to our primary operating facilities, we also lease office space that is used for sales, engineering and administrative activities in Argentina, Brazil, Germany, India, China and Australia.
We believe that our properties have been adequately maintained, are generally in good condition, and are suitable and adequate for our business as presently conducted. The extent of utilization of our properties varies from time to time and among our facilities.
From time to time we are involved in routine litigation incidental to the conduct of our business. We do not believe that any pending litigation will have a material adverse effect on our consolidated financial position or results of operations.
ITEM 4. MINE SAFETY DISCLOSURE
Not applicable.
30
ITEM 5. MARKET FOR REGISTRANT'S COMMON EQUITY,
RELATED STOCKHOLDER MATTERS AND
ISSUER PURCHASES OF EQUITY SECURITIES
Market Information
Our Common Stock has been trading publicly under the symbol SNHY on the Nasdaq Global Select Market since our initial public offering on January 9, 1997.
Holders
There were 188 shareholders of record of Common Stock on February 15, 2019. The number of record holders was determined from the records of our transfer agent and does not include beneficial owners of Common Stock whose shares are held in the names of securities brokers, dealers, and registered clearing agencies.
Dividends
We have historically paid regular quarterly dividends of $0.09 per share. In addition, we declared a special cash dividend in 2017 equal to $0.02 per share. Our board of directors currently intends to continue to pay a quarterly dividend of $0.09 per share during 2019. However, the declaration and payment of future dividends is subject to the sole discretion of the board of directors, and any determination as to the payment of future dividends will depend upon our profitability, financial condition, capital needs, acquisition opportunities, future prospects and other factors deemed pertinent by the board of directors.
Equity Compensation Plans
Information called for by Item 5 is provided in Note 13 of the Notes to the Consolidated Financial Statements included in this Annual Report (Item 8 of this report).
Issuer Purchases of Equity Securities
We did not repurchase any of our stock during the years ended December 29, 2018 and December 30, 2017.
31
Five-Year Stock Performance Graph
The following graph compares cumulative total return among Helios, the Russell 2000 Index and the Dow Jones US Diversified Industries Index, from December 28, 2013, to December 29, 2018, assuming $100 invested in each on December 28, 2013. Total return assumes reinvestment of any dividends for all companies considered within the comparison. The stock price performance shown in the graph is not necessarily indicative of future price performance.
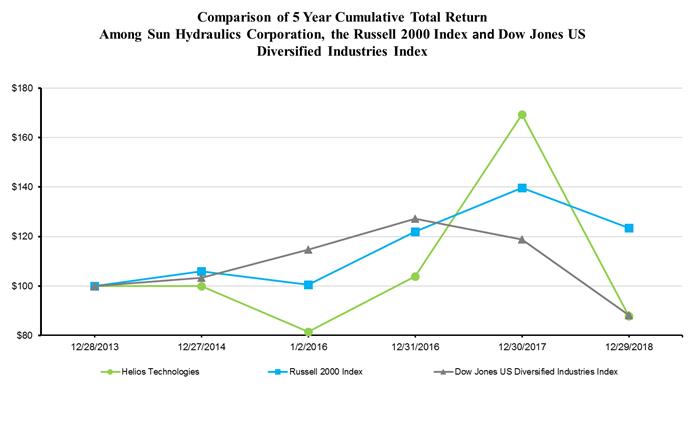
|
|
|
12/27/2014 |
|
|
1/2/2016 |
|
|
12/31/2016 |
|
|
12/30/2017 |
|
|
12/29/2018 |
|
|||||
|
Helios Technologies |
|
|
100.02 |
|
|
|
81.48 |
|
|
|
103.88 |
|
|
|
169.27 |
|
|
|
87.88 |
|
|
Russell 2000 Index |
|
|
106.00 |
|
|
|
100.49 |
|
|
|
121.91 |
|
|
|
139.76 |
|
|
|
123.38 |
|
|
Dow Jones US Diversified Industries Index |
|
|
103.37 |
|
|
|
114.60 |
|
|
|
127.15 |
|
|
|
118.77 |
|
|
|
88.25 |
|
32
ITEM 6. SELECTED CONSOLIDATED FINANCIAL DATA
The following summary should be read in conjunction with the consolidated financial statements and related notes contained herein. See "Item 7. Management's Discussion and Analysis of Financial Condition and Results of Operations" and "Item 1. Business."
We report on a fiscal year that ends on the Saturday closest to December 31st. Each quarter generally consists of thirteen weeks. The 2018 and 2017 fiscal years ended December 29, 2018 and December 30, 2017, respectively. The 2015 fiscal year ended January 2, 2016; as a result, the quarter ended January 2, 2016 consisted of fourteen weeks, resulting in a 53-week year.
|
|
|
Year ended |
|
|||||||||||||||||
|
|
|
Dec 29, 2018 |
|
|
Dec 30, 2017 |
|
|
Dec 31, 2016 |
|
|
Jan 2, 2016 |
|
|
Dec 27, 2014 |
|
|||||
|
|
|
(in thousands except per share data) |
|
|||||||||||||||||
|
Statement of Operations: |
|
|
|
|
|
|
|
|
|
|
|
|
|
|
|
|
|
|
|
|
|
Net sales |
|
$ |
508,045 |
|
|
$ |
342,839 |
|
|
$ |
196,934 |
|
|
$ |
200,727 |
|
|
$ |
227,673 |
|
|
Gross profit |
|
|
192,683 |
|
|
|
136,525 |
|
|
|
71,349 |
|
|
|
77,093 |
|
|
|
93,892 |
|
|
Operating income |
|
|
75,554 |
|
|
|
61,491 |
|
|
|
34,459 |
|
|
|
46,891 |
|
|
|
64,071 |
|
|
Income before income taxes |
|
|
56,395 |
|
|
|
47,544 |
|
|
|
34,901 |
|
|
|
49,230 |
|
|
|
65,742 |
|
|
Net income |
|
|
46,730 |
|
|
|
31,558 |
|
|
|
23,304 |
|
|
|
33,138 |
|
|
|
43,775 |
|
|
Basic and diluted net income per common share |
|
|
1.49 |
|
|
|
1.17 |
|
|
|
0.87 |
|
|
|
1.24 |
|
|
|
1.65 |
|
|
Dividends per common share |
|
|
0.36 |
|
|
|
0.38 |
|
|
|
0.40 |
|
|
|
0.45 |
|
|
|
1.45 |
|
|
Other Financial Data: |
|
|
|
|
|
|
|
|
|
|
|
|
|
|
|
|
|
|
|
|
|
Depreciation and amortization |
|
$ |
39,714 |
|
|
$ |
19,190 |
|
|
$ |
11,318 |
|
|
$ |
9,557 |
|
|
$ |
8,718 |
|
|
Capital expenditures |
|
|
28,380 |
|
|
|
22,205 |
|
|
|
6,187 |
|
|
|
6,106 |
|
|
|
10,667 |
|
|
Balance Sheet Data: |
|
|
|
|
|
|
|
|
|
|
|
|
|
|
|
|
|
|
|
|
|
Cash and cash equivalents |
|
$ |
23,477 |
|
|
$ |
63,882 |
|
|
$ |
74,221 |
|
|
$ |
81,932 |
|
|
$ |
56,843 |
|
|
Working capital |
|
|
103,866 |
|
|
|
100,913 |
|
|
|
110,192 |
|
|
|
145,336 |
|
|
|
119,815 |
|
|
Total assets |
|
|
1,042,165 |
|
|
|
459,766 |
|
|
|
444,777 |
|
|
|
241,540 |
|
|
|
222,764 |
|
|
Total debt |
|
|
352,685 |
|
|
|
116,000 |
|
|
|
140,000 |
|
|
|
— |
|
|
|
— |
|
|
Shareholders’ equity |
|
|
530,768 |
|
|
|
272,673 |
|
|
|
236,397 |
|
|
|
222,187 |
|
|
|
198,259 |
|
Our acquisition activity impacts the comparability of the selected financial information presented above. We completed the following acquisitions during the periods presented above: Enovation Controls, LLC acquired on December 5, 2016, Faster S.r.l. acquired on April 5, 2018 and Custom Fluidpower Pty Ltd acquired on August 1, 2018. The results of operations and estimated fair value of assets acquired and liabilities assumed are included in our financial statements for all periods subsequent to the acquisition dates. Additional details of our acquisitions are provided in Note 3 of the Notes to the Consolidated Financial Statements included in this Annual Report (Item 8 of this report).
33
ITEM 7. MANAGEMENT'S DISCUSSION AND ANALYSIS OF FINANCIAL CONDITION AND RESULTS OF OPERATIONS
This Annual Report contains “forward-looking statements” (within the meaning of the Private Securities Litigation Reform Act of 1995) that are based on current expectations, estimates, forecasts, and projections, our beliefs, and assumptions made by us, including (i) our strategies regarding growth, including our intention to develop new products and undertake acquisitions; (ii) our financing plans; (iii) trends affecting our financial condition or results of operations; (iv) our ability to continue to control costs and to meet our liquidity and other financing needs; (v) the declaration and payment of dividends; and (vi) our ability to respond to changes in customer demand domestically and internationally, including as a result of standardization. In addition, we may make other written or oral statements, which constitute forward-looking statements, from time to time. Words such as “may,” “expects,” “projects,” “anticipates,” “intends,” “plans,” “believes,” “seeks,” “estimates,” variations of such words, and similar expressions are intended to identify such forward-looking statements. Similarly, statements that describe our future plans, objectives or goals also are forward-looking statements. These statements are not guarantees of future performance and are subject to a number of risks and uncertainties, including those discussed below and elsewhere in this report. Our actual results may differ materially from what is expressed or forecasted in such forward-looking statements, and undue reliance should not be placed on such statements. All forward-looking statements are made as of the date hereof, and we undertake no obligation to update any forward-looking statements, whether as a result of new information, future events or otherwise.
Factors that could cause actual results to differ materially from what is expressed or forecasted in such forward-looking statements include, but are not limited to: (i) conditions in the capital markets, including the interest rate environment and the availability of capital; (ii) changes in the competitive marketplace that could affect our revenue and/or cost bases, such as increased competition, lack of qualified engineering, marketing, management or other personnel, and increased labor and raw materials costs; (iii) new product introductions, product sales mix and the geographic mix of sales nationally and internationally, and (iv) the risk factors contained in this Annual Report on Form 10-K.
The operating results of the Hydraulics and Electronics segments included in MD&A are presented on a basis consistent with our internal management reporting. Segment information included in Note 17 of the Notes to the Consolidated Financial Statements included in this Annual Report is also presented on this basis. All differences between our internal management reporting basis and accounting principles generally accepted in the United States (“U.S. GAAP”), specifically the allocation of certain corporate and acquisition-related costs, are included in Corporate and Other.
Overview
We are an industrial technology leader that develops and manufactures solutions for both the hydraulics and electronics markets, each of which serves as a reportable segment. Our Hydraulics segment consists of Sun Hydraulics, Faster and Custom Fluidpower. Sun Hydraulics is a leading designer and manufacturer of high-performance screw-in hydraulic cartridge valves and manifolds, which control force, speed and motion as integral components in fluid power systems. Faster is a leading global manufacturer of quick release hydraulic coupling solutions focused in the agriculture, construction equipment and industrial markets. Custom Fluidpower is a global provider of hydraulic, pneumatic, electronic and instrumentation solutions to a broad range of industries including agriculture, industrial, mining and material handling. The Electronics segment, which consists of Enovation Controls, is a global provider of innovative electronic control, display and instrumentation solutions for both recreational and off-highway vehicles, as well as stationary and power generation equipment.
34
On August 6, 2018, we announced the adoption of Helios Technologies as our business name. Sun Hydraulics, LLC (a newly-formed Florida limited liability company that holds the historical net operating assets of the Sun Hydraulics brand entities and Custom Fluidpower), along with Enovation Controls and Faster are the three wholly-owned operating subsidiaries of Helios Technologies under the new holding company name. The changing of the holding company business name is a reflection of the tremendous growth the Company has accomplished over the last twenty-two months, including the addition of various operating companies under our umbrella. Shares of Helios Technologies continue to trade on Nasdaq as SNHY.
Vision 2025
In 2016, we introduced our vision for the Company for the next decade. We believe it is important to reach a critical mass of $1 billion in sales by 2025 while remaining a technology leader in the industrial goods sector. To achieve our goal, we are targeting organic sales of our Hydraulics segment, including Faster and Custom Fluidpower, of approximately $730 million, sales of our Electronics segment of approximately $200 million and acquisitions of approximately $70 million in revenue. Through this growth, our decision-making process will consider our desire to maintain superior profitability and financial strength. While acquisitions remain an important component of our long-term strategy, our near-term focus is on integrating our recently acquired businesses and improving operating performance.
Product development is a key factor to organic and synergistic growth in both the Hydraulics and Electronics segments, including joint development between the two segments. In the Hydraulics segment, our most recent product introductions have been electro-hydraulics products: the FLeX™ Series Solenoid Valves and the XMD Bluetooth-configurable electro-hydraulics driver. XMD represents the first of its kind from Sun Hydraulics and was jointly engineered by a team comprised of Hydraulics and Electronics segment personnel. We expect the trend for development of similar types of products to continue as capital goods markets move toward further electrification and digitalization of machines.
Acquisitions of companies that advance our technology capabilities will be critical to achieving our Vision 2025. Target product offerings include additional CVT, CVT-adjacent hydraulic products, electronic controls and implementation, and linked technologies such as electro-mechanical actuators, factory automation, software or products relevant to the Internet of Things. Cultivating relationships with potential acquisition targets can often be a lengthy process, but we believe it is key to creating successful acquisitions with sustainable business results. We have an established list of potential targets at any given time and entertain reviewing other opportunities for acquisition as they become known to us.
Acquisitions
The December 2016 acquisition of Enovation Controls was a significant step toward realizing our vision. Enovation Controls improves and expands our technology offering, allows us to develop and market integrated solutions of electronics and hydraulics, and, most importantly, advances our electrification and digitization initiatives across our product portfolio. The acquisition brought the Company new end markets, diversification of our technology platform, and provided entry into highly sophisticated, specialized markets. Enovation Controls provides us with a large team of approximately 100 electrical, mechanical and software engineers with a track record of new product development and technical innovation. In addition, the sales team has developed strong customer relationships from which market insight can be drawn.
In April 2018, we completed our acquisition of Faster, an Italian company headquartered near Milan, Italy. Faster is a worldwide leader in engineering, manufacturing, marketing and distribution of hydraulic coupling solutions. The completion of this acquisition brings us another step closer to the realization of our Vision 2025. Faster fits this strategy well and upholds a strongly innovative culture, driving new product development and market leadership. Faster further diversifies the Company more deeply into the global agriculture market. The business also broadens our global footprint, advancing our “in the region, for the region” initiative.
35
On August 1, 2018, we completed our acquisition of Custom Fluidpower, a leading provider of hydraulic, pneumatic, electronic and instrumentation solutions. The company supplies hydraulic, pneumatic, filtration and lubrication products and offers complete system design, installation and commissioning, and service and repairs, to a broad range of industries including agriculture, aerospace, exploration, industrial, marine, mobile, mining and material handling. Headquartered in Newcastle, NSW, Australia, Custom Fluidpower has operational branches co-located with its headquarters as well as throughout Australia. Custom Fluidpower further diversifies our hydraulics product and service portfolio and provides regional value-add capabilities to continue successful penetration of the APAC region and particularly Southeast Asia.
2017 Restructure
On December 29, 2017, we merged the operations of two of our wholly owned subsidiaries in our Electronics segment, High Country Tek (“HCT”) and Enovation Controls. Enovation Controls was the surviving legal entity and continues to sell HCT products under the HCT™ brand. HCT historically operated from its facility in Nevada City, California. The HCT operations were relocated to Enovation Controls’ Tulsa manufacturing facility. Costs of the restructuring totaled $1.4 million and were related primarily to severance costs. These costs are included in the cost of sales and restructuring charges line items in the Consolidated Statements of Operations for 2017.
Industry Conditions
Market demand for our products is dependent on demand for the industrial goods in which the products are incorporated. The capital goods industries in general, and the Hydraulics and Electronics segments specifically, are subject to economic cycles. According to the National Fluid Power Association (the fluid power industry’s trade association in the United States), the United States index of shipments of hydraulic products increased 13% in 2018, after increasing 11% in 2017 and decreasing 9% in 2016. The Institute of Printed Circuits Association reports that slowing growth continues for North American electronics business while leading indicators are mixed. Sales growth for printed circuit boards (PCB) and semiconductors has slowed while sales growth remains flat for electronics manufacturing services (EMS). Indicators suggest the likelihood of continued sales growth in the electronics industry into the first quarter of 2019.
We utilize industry trend reports from various sources, as well as feedback from customers and distributors, to evaluate economic trends. We also rely on global government statistics such as Gross Domestic Product and Purchasing Managers Index to understand higher level economic conditions.
2018 Results and Comparison of Years Ended December 29, 2018 and December 30, 2017
Faster and Custom Fluidpower were acquired on April 5, 2018 and August 1, 2018, respectively. Our consolidated operating results for the year ended December 29, 2018 include the results of these Companies subsequent to their respective acquisition dates. For comparability we have presented results for Sun, Faster and Custom Fluidpower separately, in the Hydraulics segment results section.
|
(in millions except net income per share) |
|
For the year ended |
|
|
|
|
|
|
|
|
|
|||||
|
|
|
December 29, 2018 |
|
|
December 30, 2017 |
|
|
$ Change |
|
|
% Change |
|
||||
|
Net sales |
|
$ |
508.0 |
|
|
$ |
342.8 |
|
|
$ |
165.2 |
|
|
|
48.2 |
% |
|
Gross profit |
|
$ |
192.7 |
|
|
$ |
136.5 |
|
|
$ |
56.2 |
|
|
|
41.2 |
% |
|
Gross profit % |
|
|
37.9 |
% |
|
|
39.8 |
% |
|
|
|
|
|
|
|
|
|
Operating income |
|
$ |
75.6 |
|
|
$ |
61.5 |
|
|
$ |
14.1 |
|
|
|
22.9 |
% |
|
Operating income % |
|
|
14.9 |
% |
|
|
17.9 |
% |
|
|
|
|
|
|
|
|
|
Net income |
|
$ |
46.7 |
|
|
$ |
31.6 |
|
|
$ |
15.1 |
|
|
|
47.8 |
% |
|
Basic and diluted net income per common share |
|
$ |
1.49 |
|
|
$ |
1.17 |
|
|
$ |
0.32 |
|
|
|
27.4 |
% |
36
Consolidated sales for the 2018 year improved to $508.0 million, 48.2%, over the prior year, of which $106.5 million, 31.1%, was contributed by Faster, $20.3 million, 5.9%, was contributed by Custom Fluidpower, and $38.4 million, 11.2%, was a result of organic growth. Demand for our products remained strong and we continue to see sales growth in most of our geographic regions and end markets. Price increases positively impacted sales for the year by $2.1 million. Changes in foreign currency exchange rates favorably impacted the sales and earnings per share (“EPS”) of our historical businesses during the current year by $3.1 million and $0.01, respectively, when compared to the prior year. Compared with foreign currency exchange rates in effect at the respective acquisition dates, changes in exchange rates had an unfavorable impact on the sales of our acquired businesses during the period subsequent to acquisition by $5.2 million, and unfavorably impacted EPS for the year by $0.02.
Gross profit margin declined 1.9 percentage points during 2018 from 39.8% to 37.9%. The addition of Faster and Custom Fluidpower impacted consolidated gross profit margin for the period. Additional detail of this impact is presented in the Hydraulics segment results section. Gross margin for the 2018 year was further affected by $4.4 million of amortization of acquisition related inventory step up costs resulting from the Faster and Custom Fluidpower acquisitions. The gross profit margin of our legacy businesses improved 0.6 percentage points to 40.4% during the 2018 year driven by increased sales volume, price increases and a reduction of operational inefficiencies that were realized in the fourth quarter of the prior year.
Operating income margin fell 3.0 percentage points compared to the prior year, primarily due to the inventory step-up amortization referred to above, an increase of $14.8 million in acquisition related amortization of intangible assets and $5.5 million in transaction costs for the Faster and Custom Fluidpower acquisitions.
Net income and EPS were negatively impacted by the change in fair value of contingent consideration liabilities incurred in connection with the Enovation Controls and Faster acquisitions during 2018 totaling $1.2 million and $0.04, net of tax, respectively. In the prior year the negative impact of these items on sales and EPS, net of tax, totaled $6.1 million and $0.22, respectively.
2019 Outlook
Consolidated revenue for the full year 2019 is expected to be between $590 million and $600 million, with the Hydraulics segment contributing between $464 million and $469 million and the Electronics segment contributing between $126 million and $131 million. Consolidated U.S. GAAP EPS is expected to be $2.10 to $2.20 for the full year 2019. Consolidated non-GAAP cash EPS, which excludes amortization expense and certain one-time costs, is expected to be between $2.55 and $2.65. The full year adjusted EBITDA margin, prior to certain one-time costs, is anticipated to be 24.5% to 25.5%.
37
Segment Results
Hydraulics
The Hydraulics segment provides the global capital goods industries with hydraulic components and systems used to transmit power and control force, speed and motion. On a component level, Sun Hydraulics designs and manufactures screw-in hydraulic cartridge valves, manifolds, and integrated fluid power packages and subsystems used in hydraulic systems. The Hydraulics segment includes the results of Faster and Custom Fluidpower subsequent to their acquisitions on April 5, 2018 and August 1, 2018, respectively. On a component level, Faster designs and manufactures quick release couplings, multi connections and casting solutions for all hydraulics applications at medium, high and extremely high pressures. Custom Fluidpower is a supplier of hydraulics, pneumatic, filtration and lubrication products and offers complete system design, installation and commissioning, and service and repairs. The following table sets forth the results of operations for the Hydraulics segment (in millions):
|
|
|
For the year ended |
|
|
|
|
|
|
|
|
|
|||||
|
|
|
December 29, 2018 |
|
|
December 30, 2017 |
|
|
$ Change |
|
|
% Change |
|
||||
|
Net sales |
|
$ |
381.8 |
|
|
$ |
230.7 |
|
|
$ |
151.1 |
|
|
|
65.5 |
% |
|
Gross profit |
|
$ |
141.7 |
|
|
$ |
91.7 |
|
|
$ |
50.0 |
|
|
|
54.5 |
% |
|
Gross profit % |
|
|
37.1 |
% |
|
|
39.7 |
% |
|
|
|
|
|
|
|
|
|
Operating income |
|
$ |
83.9 |
|
|
$ |
54.9 |
|
|
$ |
29.0 |
|
|
|
52.8 |
% |
|
Operating income % |
|
|
22.0 |
% |
|
|
23.8 |
% |
|
|
|
|
|
|
|
|
Sun, Faster and Custom Fluidpower results are as follows (in millions):
|
|
|
For the year ended December 29, 2018 |
|
|||||||||
|
|
|
Sun Hydraulics |
|
|
Faster |
|
|
Custom Fluidpower |
|
|||
|
Net sales |
|
$ |
255.0 |
|
|
$ |
106.5 |
|
|
$ |
20.3 |
|
|
Gross profit |
|
$ |
98.7 |
|
|
$ |
37.0 |
|
|
$ |
6.0 |
|
|
Gross profit % |
|
|
38.7 |
% |
|
|
34.7 |
% |
|
|
29.6 |
% |
|
Operating income |
|
$ |
61.0 |
|
|
$ |
21.4 |
|
|
$ |
1.5 |
|
|
Operating income % |
|
|
23.9 |
% |
|
|
20.1 |
% |
|
|
7.4 |
% |
Net sales for the Hydraulics segment totaled $381.8 million in 2018, representing growth of $151.1 million, 65.5%, over the prior year. Faster and Custom Fluidpower contributed $106.5 million and $20.3 million during the year respectively. Sun Hydraulics net sales increased $24.3 million over the prior year. Sun’s growth was driven by increased demand in all geographic markets with the strongest growth occurring in the Asia/Pacific region. While demand has remained strong, supply chain and capacity constraints have limited growth in shipments, increasing Sun’s backlog. Sun’s ability to grow at an even further accelerated pace was affected by the Sarasota manufacturing consolidation project. The project involves relocating Sun’s U.S. manufacturing operations into 2 adjacent facilities in Sarasota, implementing lean manufacturing and streamlining the production process. The third facility will be utilized as an expanded state-of-the-art testing center for our engineering teams. Production capacity is expected to improve at least 15% throughout 2019. The manufacturing consolidation project is expected to be complete at the end of the first quarter of 2019.
Sun implemented price increases during the third quarter of 2018, which partially offset material cost increases and resulted in an estimated $2.1 million increase in sales during the year.
Changes in exchange rates had a favorable impact on Sun’s sales totaling $2.6 million, compared to the prior year. Since the acquisition of Faster in April 2018, the euro declined in value to the U.S. dollar resulting in an unfavorable impact on Faster sales of $4.6 million during the period. Since the acquisition of Custom Fluidpower in August of 2018, the Australian dollar declined in value to the U.S. dollar resulting in an unfavorable impact on Custom Fluidpower sales of $0.6 million during the period.
38
The following table presents net sales based on the geographic region of the sale for the Hydraulics segment (in millions):
|
|
|
For the year ended |
|
|
|
|
|
|
|
|
|
|||||
|
|
|
December 29, 2018 |
|
|
December 30, 2017 |
|
|
$ Change |
|
|
% Change |
|
||||
|
Americas |
|
$ |
148.7 |
|
|
$ |
103.9 |
|
|
$ |
44.8 |
|
|
|
43.1 |
% |
|
Europe/Middle East/Africa |
|
|
129.6 |
|
|
|
66.2 |
|
|
|
63.4 |
|
|
|
95.8 |
% |
|
Asia/Pacific |
|
|
103.5 |
|
|
|
60.6 |
|
|
|
42.9 |
|
|
|
70.8 |
% |
|
Total |
|
$ |
381.8 |
|
|
$ |
230.7 |
|
|
|
|
|
|
|
|
|
For the 2018 year, Faster contributed $34.8 million, $60.3 million and $11.4 million to our sales in the Americas, EMEA and Asia/Pacific regions, respectively. Custom Fluidpower contributed $20.3 million to our sales in the Asia/Pacific region during 2018.
Demand continued to be strong in the Americas region during 2018 with organic sales increasing $9.9 million, 9.5%, compared to the prior year. Organic sales to the EMEA region during 2018 increased $3.0 million, 4.5%, compared to the prior year, primarily due to increased demand in Germany and the U.K. Exchange rates had a favorable impact on sales to the EMEA region of $1.7 million during 2018, compared to 2017. Organic sales to the Asia/Pacific region during 2018 were up $11.4 million, 18.8%, compared to 2017. Increased demand in China and South Korea and sales and marketing initiatives in the region led to the growth. Exchange rates had a favorable impact on organic sales to the Asia/Pacific region during 2018 of $0.9 million, compared to 2017.
Hydraulics segment gross profit grew $50.0 million, 54.5%, in 2018. Faster contributed $37.0 million of the increase, representing 34.7% gross profit margin. Custom Fluidpower contributed $6.0 million of the increase, representing 29.6% gross profit margin. Custom Fluidpower is a value-add integrator business which typically earns lower margins than our manufacturing businesses. Sun’s gross profit increased $7.0 million, 7.6%, over the prior year while the gross profit margin declined 1.0 percentage point to 38.7%. Increased sales volume and price increases impacted Sun’s gross profit by approximately $7.6 million and $2.1 million during the year, respectively. Sun’s decrease in margin was driven by higher material costs due to inflationary pressure in the supply chain, partially offset by price increases, and was further impacted by Sun’s manufacturing consolidation project in Sarasota, FL, which disrupted productivity during the second half of the year.
Operating income grew $29.0 million, 52.8%, in 2018 to $83.9 million compared to $54.9 million in 2017. Operating margin declined 1.8 percentage points to 22.0% from 23.8% in 2017. Faster and Custom Fluidpower contributed $21.4 and $1.5 million of the increase, respectively, representing 20.1% and 7.4% operating margins for the year, respectively. Sun’s operating income grew $6.1 million, 11.1%, in 2018 and margin increased 0.1 percentage point over the prior year, to 23.9%. The improvement in Sun’s operating income during 2018 was primarily due to sales volume and price increases. Sun’s selling, engineering and administrative costs (“SEA”) as a percentage of sales decreased to 14.7% in 2018 compared to 15.8% in 2017.
SEA expenses rose $21.1 million, 57.7%, to $57.6 million in 2018, compared to $36.5 million in the prior year. Faster and Custom Fluidpower SEA costs totaled $15.6 million and $4.5 million during 2018, respectively. Sun SEA costs increased $1.0 million, 2.6%, over the prior year, while Sun’s SEA margin decreased by 1.1 percentage point primarily due to our leverage of fixed costs on higher sales. In addition, $4.9 million of costs to support Helios’s corporate operations were allocated to the segment during the year. These costs primarily consisted of payroll and professional fees incurred directly by the Helios entity.
39
Electronics
The Electronics segment designs and manufactures electronic control, display and instrumentation solutions for recreational and off-highway vehicles and stationary and power generation equipment. Product categories include traditional mechanical and electronic gauge instrumentation; plug and go CAN-based instruments; after-market support through global distribution; complete, custom panel and console offerings; engineering and application specialists; 3D solid modeling; proprietary hardware and software development and wiring harness design and manufacturing. The following table sets forth the results of operations for the Electronics segment (in millions):
|
|
|
For the year ended |
|
|
|
|
|
|
|
|
|
|||||
|
|
|
December 29, 2018 |
|
|
December 30, 2017 |
|
|
$ Change |
|
|
% Change |
|
||||
|
Net sales |
|
$ |
126.2 |
|
|
$ |
112.2 |
|
|
$ |
14.0 |
|
|
|
12.5 |
% |
|
Gross profit |
|
$ |
55.4 |
|
|
$ |
46.6 |
|
|
$ |
8.8 |
|
|
|
18.9 |
% |
|
Gross profit % |
|
|
43.9 |
% |
|
|
41.5 |
% |
|
|
|
|
|
|
|
|
|
Operating income |
|
$ |
25.0 |
|
|
$ |
17.9 |
|
|
$ |
7.1 |
|
|
|
39.7 |
% |
|
Operating income % |
|
|
19.8 |
% |
|
|
16.0 |
% |
|
|
|
|
|
|
|
|
Net sales for our Electronics segment totaled $126.2 million in 2018, an increase of $14.0 million, 12.5%, over the prior year. The sales growth was driven by demand in the industrial, power generation, construction and recreational vehicle end markets, our proactive sales initiatives and increased product offerings. Changes in exchange rates had a favorable impact on 2018 sales of $0.6 million.
The following table presents net sales based on the geographic region of the sale for the Electronics segment (in millions):
|
|
|
For the year ended |
|
|
|
|
|
|
|
|
|
|||||
|
|
|
December 29, 2018 |
|
|
December 30, 2017 |
|
|
$ Change |
|
|
% Change |
|
||||
|
Americas |
|
$ |
108.9 |
|
|
$ |
95.0 |
|
|
$ |
13.9 |
|
|
|
14.6 |
% |
|
Europe/Middle East/Africa |
|
|
10.1 |
|
|
|
10.9 |
|
|
|
(0.8 |
) |
|
|
(7.3 |
)% |
|
Asia/Pacific |
|
|
7.2 |
|
|
|
6.3 |
|
|
|
0.9 |
|
|
|
14.3 |
% |
|
Total |
|
$ |
126.2 |
|
|
$ |
112.2 |
|
|
|
|
|
|
|
|
|
Demand continued to be strong in the Americas region with sales growth of $13.9 million, 14.6%, over the prior year. Sales to the EMEA region declined $0.8 million, 7.3%, over the prior year, impacted by project timing. Exchange rates had a favorable impact on sales to the EMEA region of $0.5 million for the year. Sales to the Asia/Pacific region increased $0.9 million, 14.3%, over the prior year. Exchange rates had a favorable impact on Asia/Pacific sales during 2018 of $0.1 million.
Gross profit grew $8.8 million, 18.9%, in 2018 and gross profit margin increased 2.4 percentage points, up to 43.9% from 41.5% in 2017. Increased sales volume impacted gross profit by $4.1 million. Gross margin for the 2017 year was unfavorably impacted by $3.0 million of operational items including excess scrap adjustments and inventory write offs that resulted from new product manufacturing and the addition of a new manufacturing process for surface mount technology production. These issues were directly related to the complex carve-out of the two Enovation Controls lines of business that were acquired in December of 2016. During 2018, we benefited from process efficiencies that resulted from our ability to get ahead of the learning curve for SMT production as well as process improvements that led to a significant reduction of scrap adjustments.
40
Operating income increased $7.1 million, 39.7%, in 2018 over the 2017 year and operating margin increased 3.8 percentage points, up to 19.8% from 16.0% in 2017. SEA expenses grew $2.8 million, 10.1%, to $30.4 million in 2018 compared to $27.6 million during the 2017 year primarily to support revenue growth. The improvement in operating income was primarily related to sales volume, price increases and process efficiencies. Included in cost of sales and restructuring charges for 2017 is $0.4 million and $1.0 million, respectively, of charges related to the merger of Enovation Controls and HCT. In addition, $1.5 million of costs to support Helios’s corporate operations were allocated to the segment during the 2018 year. These costs primarily consisted of payroll and professional fees incurred directly by the Helios entity.
Corporate and Other
Certain costs are excluded from business segment results as they are not used in evaluating the results of, or in allocating resources to, our operating segments. Corporate and other costs increased over 2017 by $22.0 million, which was due to Faster and Custom Fluidpower acquisition-related charges. For the year ended December 29, 2018, these costs totaled $33.4 million and were primarily for acquisition-related items such as Faster and Custom Fluidpower transaction costs of $5.5 million, charges related to inventory step-up to fair value of $4.4 million, amortization of acquisition-related intangible assets of $23.0 million and $0.5 million related to other acquisition activities and corporate projects and initiatives. For the year ended December 30, 2017, these costs totaled $11.4 million and included corporate costs not deemed to be allocable to our business segments of $1.4 million, acquisition-related costs including charges related to inventory step-up to fair value of $1.8 million, and amortization of acquisition-related intangible assets of $8.2 million.
Interest Expense, net
Net interest expense increased $10.1 million during 2018 to $13.9 million compared to $3.8 million for 2017. This increase is attributable to the additional borrowings on our credit facility during the year to fund acquisition activity. Average net debt for the year ended December 29, 2018, totaled $190.7 million compared to $59.0 million for the year ended December 30, 2017.
Change in Fair Value of Contingent Consideration
The fair value of our acquisition-related contingent consideration liability is revalued each quarter to its estimated fair value, and changes are recorded in earnings of the period. Changes in fair value are primarily a result of actual sales volume and EBITDA results of Enovation Controls for the periods as well as changes in the probabilities of estimated future sales volume and EBITDA results of Enovation Controls. During 2018, we recognized an increase in the fair value of the liability totaling $1.5 million, compared to an increase of $9.5 million during 2017.
Income Taxes
The provision for income taxes for the year ended December 29, 2018, was 17.1% of pretax income compared to 33.6% for the year ended December 30, 2017. These effective rates typically fluctuate relative to the levels of income and different tax rates in effect among the countries in which we sell our products. The 2017 and 2018 rates were also impacted by the US tax reform.
41
On December 22, 2017, the Tax Cuts and Jobs Act of 2017 (the “Act”) was signed into law making significant changes to the Internal Revenue Code. Changes included, but were not limited to, a corporate tax rate decrease from 35% to 21% effective for tax years beginning after December 31, 2017, the transition of U.S international taxation from a worldwide tax system to a territorial system, and a one-time transition tax on the mandatory deemed repatriation of cumulative foreign earnings as of December 31, 2017. As a result of the Act, recorded in our 2017 year-end income tax provision were $0.5 million of additional income tax expense, including a benefit of $1.5 million related to remeasurement of deferred tax assets and liabilities and $2.0 million of expense related to one-time transition tax on mandatory deemed repatriation of foreign earnings. Refinements to these items were made during 2018 for the purpose of 2017 tax return reporting, and provision-to-return adjustments have been recorded in the 2018 year-end provision to adjust the transition tax to $0.6 million. We elected to pay the transition tax over an eight year period, as proscribed by the legislation.
On December 22, 2017, Staff Accounting Bulletin No. 118 ("SAB 118") was issued to address the application of US GAAP in situations when a registrant does not have the necessary information available, prepared, or analyzed in reasonable detail to complete the accounting for certain income tax effects of the Act. In accordance with SAB 118, we determined the $1.5 million of deferred tax benefit recorded related to remeasurement of deferred tax assets and liabilities and $2.0 million of current tax expense recorded related to transition tax on mandatory deemed repatriation of foreign earnings were provisional amounts and reasonable estimates at December 30, 2017. For 2018 year-end provision purposes, additional work was performed to complete a more detailed analysis of our deferred tax assets and liabilities, our historical attributes giving rise to the transition tax calculation inputs, and potential correlative adjustments of each of these items. Adjustments to these amounts were recorded to current tax expense in 2018.
Further, in accordance with SAB 118, we continued evaluating our permanent reinvestment assertion as further consideration is given to how the Act impacts the future cash flow position of the Company. Our foreign subsidiaries generate earnings that are not subject to U.S. income taxes so long as they are permanently reinvested in our operations outside of the U.S. Pursuant to ASC Topic No. 740-30 (formerly APB 23), undistributed earnings of foreign subsidiaries that are no longer permanently reinvested would become subject to deferred income taxes under U.S. tax law. In determining if the undistributed earnings of our foreign subsidiaries are permanently reinvested, we consider the following: (i) the forecasts, budgets, debt commitments, and cash requirements of our U.S business and our foreign subsidiaries, both for the short and long term; (ii) the tax consequences of any decision to reinvest foreign earnings, including any changes in U.S. income tax law relating to the treatment of these undistributed foreign earnings; and (iii) any U.S. and foreign government programs or regulations relating to the repatriation of these unremitted earnings. As of December 29, 2018, we have recognized deferred income taxes of approximately $31 thousand on earnings that are no longer permanently reinvested in foreign operations. We assert that $19.7 million of undistributed earnings are permanently reinvested in our foreign operations and have no current plans to repatriate those earnings.
In January 2018, the FASB released guidance on the accounting for tax on the global intangible low-taxed income (“GILTI”) provisions of the Act. The GILTI provisions impose a tax on foreign income in excess of a deemed return on tangible assets of foreign corporations. The guidance indicates that either accounting for deferred taxes related to GILTI inclusions or treating any taxes on GILTI inclusions as a period cost are acceptable methods subject to an accounting policy election. We have elected to treat any taxes on GILTI inclusions as period costs. We had also recorded estimates in the 2017 year-end provision in accordance with SAB 118 for certain directly- and indirectly-correlated effects in our year end income tax provision including, but not limited to, state and local income taxes, domestic production activities deduction, and fixed asset depreciation. These effects have been further evaluated and final determinations recorded of the appropriate accounting for the Act.
42
2017 Results and Comparison of Years Ended December 30, 2017 and December 31, 2016
|
(in millions except net income per share) |
|
For the year ended |
|
|
|
|
|
|
|
|
|
|||||
|
|
|
December 30, 2017 |
|
|
December 31, 2016 |
|
|
$ Change |
|
|
% Change |
|
||||
|
Net sales |
|
$ |
342.8 |
|
|
$ |
196.9 |
|
|
$ |
145.9 |
|
|
|
74.1 |
% |
|
Gross profit |
|
$ |
136.5 |
|
|
$ |
71.3 |
|
|
$ |
65.2 |
|
|
|
91.4 |
% |
|
Gross profit % |
|
|
39.8 |
% |
|
|
36.2 |
% |
|
|
|
|
|
|
|
|
|
Operating income |
|
$ |
61.5 |
|
|
$ |
34.5 |
|
|
$ |
27.0 |
|
|
|
78.3 |
% |
|
Operating income % |
|
|
17.9 |
% |
|
|
17.5 |
% |
|
|
|
|
|
|
|
|
|
Net income |
|
$ |
31.6 |
|
|
$ |
23.3 |
|
|
$ |
8.3 |
|
|
|
35.6 |
% |
|
Basic and diluted net income per common share |
|
$ |
1.17 |
|
|
$ |
0.87 |
|
|
$ |
0.30 |
|
|
|
34.5 |
% |
Consolidated sales for the 2017 year improved to $342.8 million, compared to $196.9 million in 2016, an increase of $145.9 million. Our acquisition of Enovation Controls in December of 2016 contributed largely to the increase. Organic growth from our historical business totaled 21% and was responsible for $41 million of the year-over-year improvement. We continue to see an increase in global demand driving the growth in sales in all of our geographic regions. Additionally, we are realizing returns on investments made in global sales and marketing initiatives.
Gross profit margins improved 3.6 percentage points during 2017. Contributing factors include increased sales volume, our ability to leverage our fixed costs, continuous improvement initiatives and the acquisition of Enovation Controls, whose products typically have higher gross profit margins than our historic hydraulic business. Gross profit was also unfavorably impacted by $5.7 million of operational items during the fourth quarter of 2017 which are discussed later in the segment results section.
Operating income margins saw slight improvement, 0.4 percentage points, compared to the prior year. 2017 was impacted by an increase in amortization expense totaling $6.9 million and one-time expenses such as restructuring charges incurred for the merger of HCT and Enovation Controls and a rise in corporate related costs for activities, such as our 2018 recent public equity offering and our continued efforts to locate acquisition opportunities.
Enovation Controls outperformed our forecast for 2017. The strong performance was driven by higher demand in the power controls and recreational vehicle end markets, leading to an increase in the fair value of the acquisition-related contingent consideration liability during the year. The contingent consideration is based on defined revenue and EBITDA targets through early 2019. The change in fair value during the year, in excess of the acquisition date fair value, was recognized in earnings and negatively impacted net income and EPS, net of tax, by $6.1 million and $0.22, respectively.
In addition to the negative impact of the change in fair value of contingent consideration discussed above, net income was impacted by a change in tax laws resulting from the Tax Cuts and Jobs Act, commonly referred to as “US tax reform,” which was signed into law in December of 2017. The total impact on our 2017 financial statements was $0.5 million of one-time tax expense.
43
Segment Results
Hydraulics
The following table sets forth the results of operations for the Hydraulics segment (in millions):
|
|
|
For the year ended |
|
|
|
|
|
|
|
|
|
|||||
|
|
|
December 30, 2017 |
|
|
December 31, 2016 |
|
|
$ Change |
|
|
% Change |
|
||||
|
Net sales |
|
$ |
230.7 |
|
|
$ |
189.5 |
|
|
$ |
41.2 |
|
|
|
21.7 |
% |
|
Gross profit |
|
$ |
91.7 |
|
|
$ |
69.9 |
|
|
$ |
21.8 |
|
|
|
31.2 |
% |
|
Gross profit % |
|
|
39.7 |
% |
|
|
36.9 |
% |
|
|
|
|
|
|
|
|
|
Operating income |
|
$ |
54.9 |
|
|
$ |
39.1 |
|
|
$ |
15.8 |
|
|
|
40.4 |
% |
|
Operating income % |
|
|
23.8 |
% |
|
|
20.6 |
% |
|
|
|
|
|
|
|
|
Net sales for the Hydraulics segment totaled $230.7 million in 2017, representing growth of $41.2 million, 21.7%, over the prior year. The growth was driven by increased demand in all geographic and end markets and was also impacted by global sales and marketing initiatives. No significant price increases occurred during 2017. Changes in exchange rates had a favorable impact on sales of $0.2 million for the year ended December 30, 2017.
The following table presents net sales based on the geographic region of the sale for the Hydraulics segment (in millions):
|
|
|
For the year ended |
|
|
|
|
|
|
|
|
|
|||||
|
|
|
December 30, 2017 |
|
|
December 31, 2016 |
|
|
$ Change |
|
|
% Change |
|
||||
|
Americas |
|
$ |
103.9 |
|
|
$ |
88.1 |
|
|
$ |
15.8 |
|
|
|
17.9 |
% |
|
Europe/Middle East/Africa |
|
|
66.2 |
|
|
|
58.2 |
|
|
|
8.0 |
|
|
|
13.7 |
% |
|
Asia/Pacific |
|
|
60.6 |
|
|
|
43.2 |
|
|
|
17.4 |
|
|
|
40.3 |
% |
|
|
$ |
230.7 |
|
|
$ |
189.5 |
|
|
|
|
|
|
|
|
|
|
Increased demand in the U.S. and Canada resulted in sales to the Americas growing by $15.8 million, 17.9%, during 2017.
Sales to EMEA were up $8.0 million, 13.7%, in 2017. Increased demand, primarily in the United Kingdom and Germany led to the growth. Exchange rates had an unfavorable impact on sales to EMEA of approximately $0.2 million for the year.
Sales to the Asia/Pacific region were up $17.4 million, 40.3%, in 2017. Increased demand in China and South Korea as well as sales and marketing initiatives in the region led to the growth. Exchange rates had a favorable impact on Asia/Pacific sales of $0.4 million for the year.
Gross profit grew $21.8 million, 31.2%, in 2017, and gross profit as a percentage of net sales improved to 39.7%. Increased sales volume impacted gross profit by approximately $15.2 million. Gross profit was also unfavorably impacted by $2.7 million of operational items during the fourth quarter of 2017 including standard costing adjustments resulting from improved productivity, higher than normal freight costs for expediting products to keep up with the increase in order demand and costs related to our temporary workforce and material outsourcing incurred during our recovery from downtime caused by hurricane Irma. The remainder of the growth in gross profit was a result of our ability to leverage our fixed costs, combined with continuous improvement initiatives during the period.
Operating income grew $15.8 million, 40.4%, in 2017, and operating income as a percentage of net sales improved to 23.8%. The improvement in operating income during 2017 was primarily due to sales volume and improved gross profit. Selling, engineering and administrative costs as a percentage of sales decreased to 15.8% in 2017 compared to 16.1% in 2016.
44
SEA expenses grew $6.1 million, 20.1%, to $36.5 million in 2017, compared to $30.4 million in the prior year. The fluctuations were due to the following: increased compensation costs primarily related to investments in strong talent necessary to support our initiatives to drive future revenue growth and profitability, increased professional fees for legal and advisory services related to special strategic projects and initiatives, increased investments in research and development, and lower CEO transition costs in 2017 compared to 2016.
Electronics
The following table sets forth the results of operations for the Electronics segment (in millions):
|
|
|
For the year ended |
|
|||||
|
|
|
December 30, 2017 |
|
|
December 31, 2016 |
|
||
|
Net sales |
|
$ |
112.2 |
|
|
$ |
7.4 |
|
|
Gross profit |
|
$ |
46.6 |
|
|
$ |
2.5 |
|
|
Gross profit % |
|
|
41.5 |
% |
|
|
33.8 |
% |
|
Operating income |
|
$ |
17.9 |
|
|
$ |
(0.6 |
) |
|
Operating income % |
|
|
16.0 |
% |
|
|
(8.1 |
)% |
Net sales for our Electronics segment totaled $112.2 million in 2017, of which $109.4 million were contributed by Enovation Controls. On a pro forma basis, this represented a $26.9 million, 32.6%, increase over the net sales of the PC and VT lines of business of Enovation Controls during 2016, 11 months of which was prior to our acquisition of Enovation Controls which occurred on December 5, 2016.
The sales growth was driven by demand in the power controls and recreational vehicle end markets and our proactive sales initiatives as well as increased demand for new products developed in the past year. Changes in exchange rates had an unfavorable impact on 2017 sales of $0.8 million.
The following table presents net sales based on the geographic region of the sale for the Electronics segment (in millions):
|
|
|
For the year ended |
|
|||||
|
|
|
December 30, 2017 |
|
|
December 31, 2016 |
|
||
|
Americas |
|
$ |
95.0 |
|
|
$ |
6.7 |
|
|
Europe/Middle East/Africa |
|
|
10.9 |
|
|
|
0.5 |
|
|
Asia/Pacific |
|
|
6.3 |
|
|
|
0.2 |
|
|
Total |
|
$ |
112.2 |
|
|
$ |
7.4 |
|
Sales to the Americas totaled $95.0 million during 2017. Sales to the EMEA region totaled $10.9 million during 2017. Exchange rates had a negative impact on sales to EMEA of $0.7 million for the year. Sales to the Asia/Pacific region totaled $6.3 million during 2017. Exchange rates had a minimal impact on Asia/Pacific sales during 2017.
Gross profit totaled $46.6 million during 2017, and gross profit as a percentage of net sales totaled 41.5%. Gross profit was unfavorably impacted by $3.0 million of operational items during the fourth quarter of 2017 including excess scrap adjustments and inventory write offs resulting from new product manufacturing and the addition of a new manufacturing process for surface mount technology production. These issues were directly related to the complex carve-out of the two Enovation Controls lines of business that we acquired in December of 2016. Additional contributors to the unfavorable fourth quarter impact from operational items were related to product mix, warranty expense and higher than expected temporary labor to support the increase in demand for our products.
45
Selling, engineering and administrative expenses totaled $27.6 million in 2017. Included in cost of sales and restructuring charges for 2017 is $0.4 million and $1.0 million, respectively, of charges related to the merger of Enovation Controls and HCT. The charges primarily related to severance costs. Operating income for the Electronics segment totaled $17.9 million in 2017, with an operating margin of 16.0%.
Corporate and Other
Certain costs are excluded from business segment results as they are not used in evaluating the results of, or in allocating resources to, our operating segments. For the year ended December 30, 2017, these costs included corporate costs not deemed to be allocable to our business segments of $1.4 million, acquisition-related costs including charges related to inventory step-up to fair value of $1.8 million, and amortization of acquisition-related intangible assets of $8.2 million.
Interest Expense, net
Net interest expense was $3.8 million for 2017 compared to net interest income of $0.8 million for 2016. Interest expense was $4.1 million compared to $0.5 million for 2016.
Total average cash and investments for the year ended December 30, 2017, totaled $72.5 million compared to $103.6 million for the year ended December 31, 2016. The funding of the acquisition of Enovation Controls during the fourth quarter of 2016, the payment made on contingent consideration during Q4 2017, capital expenditures and repayments of borrowings during the year were the drivers for the increases in interest expense and decreases in average cash and short-term investments.
Change in Fair Value of Contingent Consideration
The fair value of our acquisition-related contingent consideration liability is revalued each quarter to its estimated fair value, and changes are recorded in earnings of the period. Changes in fair value are primarily a result of actual sales volume and EBITDA results of Enovation Controls for the period as well as changes in the probabilities of estimated future sales volume and EBITDA results of Enovation Controls. During 2017 the fair value of the liability increased by $9.5 million over the final acquisition date fair value estimate.
Income Taxes
The provision for income taxes for the year ended December 30, 2017, was 33.6% of pretax income compared to 33.2% for the year ended December 31, 2016. These effective rates typically fluctuate relative to the levels of income and different tax rates in effect among the countries in which we sell our products. The 2017 rate was also impacted by the US tax reform.
46
Liquidity and Capital Resources
Historically, our primary source of capital has been cash generated from operations. In recent years we have used borrowings on our credit facilities to fund acquisitions, and during 2018 we raised $240 million in net proceeds from our public stock offering which was also used to fund acquisition activity during the year. During 2018 cash provided by operating activities totaled $77.5 million and as of December 29, 2018 we had $23.5 million of cash and cash equivalents on hand and $146.4 million of available credit on our revolving credit facilities. We also have a $200 million accordion feature available on our credit facility, subject to certain pro forma compliance requirements.
Our principal uses of cash have been paying operating expenses, paying dividends to shareholders, making capital expenditures, acquisition-related payments and servicing debt.
We believe that the cash generated from operations and the borrowing availability under our credit facilities will be sufficient to satisfy our operating expenses and capital expenditures for the foreseeable future. In the event that economic conditions were to severely worsen for a protracted period of time, we would have several options available to ensure liquidity in addition to increased borrowing. Capital expenditures could be postponed since they primarily pertain to long-term improvements in operations. Additional operating expense reductions also could be made. Finally, the dividend to shareholders could be reduced or suspended.
Cash flows
The following table summarizes our cash flows for the periods (in millions):
|
|
|
For the year ended |
|
|
|
|
|
|||||
|
|
|
December 29, 2018 |
|
|
December 30, 2017 |
|
|
$ Change |
|
|||
|
Net cash provided by operating activities |
|
$ |
77.5 |
|
|
$ |
49.4 |
|
|
$ |
28.1 |
|
|
Net cash used in investing activities |
|
|
(565.5 |
) |
|
|
(16.0 |
) |
|
|
(549.5 |
) |
|
Net cash provided by (used in) financing activities |
|
|
447.3 |
|
|
|
(50.0 |
) |
|
|
497.3 |
|
|
Effect of exchange rates on cash |
|
|
0.3 |
|
|
|
6.3 |
|
|
|
(6.0 |
) |
|
Net decrease in cash and cash equivalents |
|
$ |
(40.4 |
) |
|
$ |
(10.3 |
) |
|
$ |
(30.1 |
) |
Cash on hand decreased $40.4 million from $63.9 million at the end of 2017 to $23.5 million at the end of 2018. The decrease was a result of our investing activities during the year including the acquisitions of Faster in April 2018 and Custom Fluidpower in August 2018. Cash and cash equivalents were favorably impacted by changes in exchange rates during the years ended December 29, 2018 and December 30, 2017 totaling $0.3 million and $6.3 million, respectively. Cash balances on hand are a result of our cash management strategy which focuses on maintaining sufficient cash to fund operations while reinvesting cash in the Company and also paying down borrowings on our credit facilities.
Operating activities
Cash from operations increased $28.1 million, 56.9%, compared to the prior-year primarily due to a significant increase in cash earnings offset by increases in operating assets and liabilities, net of acquisitions. Changes in inventory and accounts receivable, net of acquisitions, reduced cash by $17.7 million in 2018 compared to a reduction of cash of $24.1 million during 2017.
47
Total accounts receivable, net balances grew $35.3 million as of December 29, 2018 compared to December 30, 2017, of which $33.5 million of the increase was attributable to acquisitions. The remainder of the fluctuation was a result of the growth in organic net sales over the prior year. Days sales outstanding went up to 52 days as of December 29, 2018, from 40 days as of December 30, 2017, primarily due to Faster’s and Custom Fluidpower’s collection periods exceeding that of our historical business given the business model differences. Inventory balances increased $44.4 million over the prior year, of which $35.9 million of the increase was attributable to acquisitions. Inventory levels were higher than normal in response to the strong demand in the hydraulics industry during 2018. The overall cost of inventory is also higher due to tariffs imposed on U.S. imports. Days of inventory on hand went up to 96 as of December 29, 2018, from 64 as of December 30, 2017, due to Faster’s and Custom Fluidpower’s business model differences and Sun’s supplier and capacity constraints.
Investing activities
Cash used in investing activities increased during 2018 by $549.5 million compared to 2017. Acquisitions accounted for $534.7 million of the fluctuation. Capital expenditures were $28.4 million for the year ended December 29, 2018; $6.2 million, 27.8%, higher than the prior year. Current year capital expenditures were primarily made up of purchases of machinery and equipment, Sun’s manufacturing consolidation project, and the completion of construction of our new production facility in South Korea. Capital expenditures for 2019 are estimated to be between $30 million and $35 million, primarily for investments in machinery and equipment, the completion of Sun’s manufacturing consolidation project, which includes a state-of-the-art R&D lab, and expansion of our operations in China.
Financing activities
Cash flows provided by financing activities totaled $447.3 million in 2018, compared to cash used in financing activities of $50.0 million in 2017.
On February 6, 2018, the Company issued and sold 4.4 million shares of its common stock at $57.50 per share in a registered public offering. The net increase to shareholders’ equity and cash proceeds from the offering was approximately $240 million. We initially used $116 million of the proceeds to repay the outstanding debt under our credit facility and used the remaining proceeds in April of 2018 to fund the Faster acquisition.
On April 1, 2018, we amended our credit facility to increase the limit on our revolving credit facility to $400 million and add a term loan of $100 million. We also increased the accordion feature to $200 million. During the second quarter of 2018, we paid cash of approximately $175.0 million and borrowed $358.0 million on our term loan and line of credit to complete the acquisition of Faster. During the third quarter we borrowed additional amounts on our revolving credit facility to fund the acquisition of Custom Fluidpower. Cash paid for the Custom Fluidpower acquisition totaled approximately $9.3 million. Amounts due on our revolving credit facilities and our long-term non-revolving debt as of December 29, 2018 totaled $255.8 million and $96.9 million, respectively. See Note 9 of the Notes to the Consolidated Financial Statements included in this Annual Report for additional information regarding our credit facilities.
During July 2018 and October 2017, we paid approximately $17.3 million and $17.0 million, respectively, to the former owners of Enovation Controls in connection with the first two payments due on the contingent consideration liability. In April 2019 we expect to pay the full amount of the last payment of $16.7 million, plus interest.
We have historically declared regular quarterly dividends to shareholders of $0.09. In addition to the regular quarterly dividends, we declared shared distribution cash dividends in 2017 and 2016 equal to $0.02 and $0.04, respectively. We paid dividends totaling $11.0 million, $10.3 million, and $10.7 million for the years ended December 29, 2018, December 30, 2017, and December 31, 2016, respectively.
48
The declaration and payment of future dividends is subject to the sole discretion of the Board of Directors, and any determination as to the payment of future dividends will depend upon our profitability, financial condition, capital needs, acquisition opportunities, future prospects and other factors deemed pertinent by the Board of Directors.
Contractual obligations
The timing of payments due under our contractual obligations as of December 29, 2018, are summarized in the table below (in thousands):
|
|
|
Payments due by Period |
|
|||||||||||||||||
|
CONTRACTUAL OBLIGATIONS |
|
TOTAL |
|
|
2019 |
|
|
2020-2021 |
|
|
2022-2023 |
|
|
Thereafter |
|
|||||
|
Revolving line of credit (1) |
|
$ |
255,750 |
|
|
$ |
— |
|
|
$ |
— |
|
|
$ |
255,750 |
|
|
$ |
— |
|
|
Long-term, non-revolving debt (2) |
|
|
97,983 |
|
|
|
5,460 |
|
|
|
14,936 |
|
|
|
77,587 |
|
|
|
— |
|
|
Interest on long-term debt (3) |
|
|
65,439 |
|
|
|
15,832 |
|
|
|
30,786 |
|
|
|
18,821 |
|
|
|
— |
|
|
Contingent consideration (4) |
|
|
18,960 |
|
|
|
18,120 |
|
|
|
840 |
|
|
|
— |
|
|
|
— |
|
|
Purchase commitments (5) |
|
|
47,799 |
|
|
|
26,611 |
|
|
|
21,188 |
|
|
|
— |
|
|
|
— |
|
|
Operating leases |
|
|
8,851 |
|
|
|
3,094 |
|
|
|
4,968 |
|
|
|
789 |
|
|
|
— |
|
|
Capital leases |
|
|
2,200 |
|
|
|
977 |
|
|
|
963 |
|
|
|
260 |
|
|
|
— |
|
|
Total contractual obligations |
|
$ |
496,982 |
|
|
$ |
70,094 |
|
|
$ |
73,681 |
|
|
$ |
353,207 |
|
|
$ |
— |
|
|
(1) |
Our revolving credit facility expires in April 2023. Although we may make earlier principal payments, we have reflected the principal balance due at expiration. |
|
(2) |
Amounts represent required payments on long-term non-revolving debt obligations and exclude debt issuance costs. |
|
(3) |
Interest on the revolving line of credit assumes the current interest rate environment and revolver borrowings consistent with December 29, 2018 debt levels. Interest on the non-revolving long-term debt assumes the current interest rate environment and takes into account future required payments. |
|
(4) |
Represents the fair value estimate of contractual earnout payments related to our acquisitions of Enovation Controls and Faster. |
|
(5) |
Amounts represent commitments entered into with key suppliers for minimum purchase quantities. Only obligations that are non-cancelable are included in the table. |
Critical Accounting Policies and Estimates
We prepare our consolidated financial statements in conformity with U.S. generally accepted accounting principles which requires management to make certain estimates and assumptions that affect reported amounts and related disclosures. Actual results could differ from those estimates. Based on facts and circumstances inherent in developing estimates and assumptions, we believe it is unlikely that applying other such estimates and assumptions would have caused materially different amounts to have been reported. The following policies are considered by management to be the most critical in understanding the judgements, estimates and assumptions that are involved in the preparation of our consolidated financial statements.
Allowance for Doubtful Accounts
The allowance for doubtful accounts is determined on a specific identification basis by a review of those accounts that are significantly in arrears. The allowance for doubtful accounts is estimated by each of our operating subsidiaries based on estimates of losses related to customer receivable balances. The assumptions used in determining the collectability of receivable balances are based on an evaluation of the age of receivable balances, an assessment of customer credit quality and historical collection experience with customers. Account balances are charged against the allowance when it is probable the receivable will not be recovered.
49
Inventory Valuation
Inventories are valued at the lower of cost and net realizable value, on a first-in, first-out basis. On an ongoing basis, component parts found to be obsolete through design or process changes are disposed of and charged to material cost. We review on-hand balances of products and component parts against specific criteria such as historical usage and assumptions about future demand. Products and component parts without usage or that have excess quantities on hand are evaluated. An inventory reserve is then established for the appropriate inventory value of those products and component parts deemed to be obsolete or slow moving. If actual future demand is less favorable than management projections, additional inventory write-downs may be required. See Note 5 of the Notes to the Consolidated Financial Statements included in this Annual Report for inventory reserve amounts.
Fair Value Measurements
We apply fair value accounting guidelines for all financial assets and liabilities and non-financial assets and liabilities that are recognized or disclosed at fair value in the financial statements on a recurring basis (at least annually). Under these guidelines, fair value is defined as the price that would be received for the sale of an asset or paid to transfer a liability (i.e., an exit price) in an orderly transaction between market participants at the measurement date. The guidance establishes a three-tier fair value hierarchy which prioritizes the inputs used in measuring fair value as follows:
Level 1 - Quoted prices in active markets for identical assets or liabilities.
Level 2 - Observable inputs other than quoted prices included in Level 1, such as quoted prices for similar assets or liabilities in active markets or quoted prices for identical assets or liabilities in inactive markets.
Level 3 - Unobservable inputs that are supported by little, infrequent, or no market activity and reflect the Company’s own assumptions about inputs used in pricing the asset or liability.
The fair value hierarchy also requires an entity to maximize the use of observable inputs and minimize the use of unobservable inputs when measuring fair value.
The fair value of cash and cash equivalents, accounts receivable, other current assets, accounts payable, accrued expenses and other liabilities approximates their carrying value, due to their short-term nature. Contingent consideration and newly acquired intangible assets are measured at fair value using level 3 inputs. Forward foreign exchange contracts are measured at fair value based on quoted foreign exchange forward rates at the reporting dates. The fair value of interest rate swap contracts is based on the expected cash flows over the life of the trade. Expected cash flows are determined by evaluating transactions with a pricing model using a specific market environment. The values are estimated using the closing and mid-market market rate/price environment as of the end of the period. See Note 4 of the Notes to the Consolidated Financial Statements included in this Annual Report for detail on the level of inputs used in determining the fair value of assets and liabilities.
The fair value of the contingent consideration arrangements was estimated using risk-adjusted probability analysis. The primary inputs used in the analysis included revenue and earnings forecasts and estimates of probabilities of varying outcomes. As of December 29, 2018, the contingent consideration liability incurred in connection with the Enovation Controls acquisition was valued at approximately 100% of the present value of the total possible payout. If actual results are less favorable than management projections, write-downs of the liability could occur. See Note 4 of the Notes to the Consolidated Financial Statements included in this Annual Report for changes in the estimated fair value during the year.
50
Business Combinations
Business combinations are accounted for under the acquisition method of accounting, which requires recognition separately from goodwill, of the assets acquired, and the liabilities assumed at their acquisition date fair values. Assigning fair market values to the assets acquired and liabilities assumed at the date of an acquisition requires knowledge of current market values, and the values of assets in use, and often requires the application of judgment regarding estimates and assumptions. While the ultimate responsibility resides with management, for certain acquisitions we retain the services of certified valuation specialists to assist with assigning estimated values to certain acquired assets and assumed liabilities, including intangible assets and tangible long-lived assets. Acquired intangible assets, excluding goodwill, are valued using various methodologies such as the discounted cash flow method which is based on future cash flows specific to the type of intangible asset purchased and the relief from royalty method which is based on the present value of savings resulting from the right to manufacture or sell products that incorporate the intangible asset without having to pay a license for its use. These methodologies incorporate various estimates and assumptions, the most significant being estimated royalty rates, projected revenue growth rates, profit margins and forecasted cash flows based on the discount rate.
Goodwill
Goodwill, which represents the excess of the purchase price of an acquisition over the fair value of the net assets acquired, is carried at cost. Goodwill is tested for impairment annually or more often if events or circumstances indicate a reduction in the fair value below the carrying value. The carrying value of assets is calculated at the reporting unit level. An impairment loss is recorded to the extent that the fair value of the goodwill within the reporting unit is less than its carrying value.
We primarily use an income approach methodology based on a discounted forecasted cash flow analysis to value reporting units. Assumptions used in the analysis include estimated future revenues and expenses, weighted average cost of capital, capital expenditures and other variables. Assumptions made for future cash flows are developed based on consideration of current and future economic conditions, recent sales trends, planned timing of product launches, or other relevant variables. The assessment of fair value for impairment purposes requires significant judgment by management. The estimated fair value could be impacted by changes in market conditions, growth rates, costs and other variables.
We completed our annual goodwill impairment testing for the year ended December 29, 2018, and determined that the carrying amount of goodwill was not impaired. See Note 7 of the Notes to the Consolidated Financial Statements included in this Annual Report for goodwill amounts.
Impairment of Long-Lived Assets
Long-lived assets, such as property and equipment, and purchased intangibles subject to amortization, are reviewed for impairment whenever events or changes in circumstances indicate that the carrying amount of an asset may not be recoverable. Recoverability of the asset is measured by comparison of its carrying amount to undiscounted future net cash flows that the asset is expected to generate. If such assets are considered impaired, the impairment to be recognized is measured as the amount by which the carrying amount of the asset exceeds its fair value. For the year ended December 29, 2018, there were no impairments recorded based on our analysis. If the cash flow estimates or the significant operating assumptions upon which they are based change in the future, we may be required to record impairment charges.
51
Accrued Expenses and Other Liabilities
We make estimates related to certain employee benefits and miscellaneous accruals. Estimates for employee benefit accruals are based on management’s assessment of estimated liabilities related to workers’ compensation and health care benefits. Estimates for miscellaneous accruals are based on our assessment of estimated liabilities for costs incurred.
The Company accrues for the estimated cost of product warranties at the time revenue is recognized. The estimates are based upon current and historical warranty trends and other related information known to the Company.
Income Taxes
Our income tax policy provides for a liability approach under which deferred income taxes are provided for based upon enacted tax laws and rates applicable to the periods in which the taxes become payable. These differences result from items reported differently for financial reporting and income tax purposes, primarily depreciation, accrued expenses and reserves.
We report a liability for unrecognized tax benefits resulting from uncertain tax positions taken or expected to be taken in a tax return. We recognize potential interest and penalties related to our unrecognized tax benefits in income tax expense. We file U.S. federal income tax returns as well as income tax returns in various states and foreign jurisdictions. We are no longer subject to income tax examinations by tax authorities for years prior to 2008 for the majority of tax jurisdictions.
Our U.S. federal returns are not currently under examination by the Internal Revenue Service (IRS). Our Florida returns are under examination for tax years 2015 and 2016. Faster’s pre-acquisition 2016 Italian return is also under examination. To date, there have not been any significant proposed adjustments that have not been accounted for in the Company’s consolidated financial statements. Audit outcomes and the timing of audit settlements are subject to significant uncertainty. It is reasonably possible that within the next twelve months we will resolve some or all of the matters presently under consideration by the Florida Department of Revenue and that there could be significant increases or decreases to unrecognized tax benefits. See Note 12 of the Notes to the Consolidated Financial Statements included in this Annual Report for income tax amounts, including reserves.
Off Balance Sheet Arrangements
We do not engage in any off balance sheet financing arrangements. In particular, we do not have any material interest in variable interest entities, which include special purpose entities and structured finance entities.
Inflation
The impact of inflation on our operating results has been moderate in recent years, reflecting generally lower rates of inflation in the economy. While inflation has not had, and we do not expect that it will have, a material impact upon operating results, there is no assurance that our business will not be affected by inflation in the future.
52
ITEM 7A. QUANTITATIVE AND QUALITATIVE DISCLOSURES ABOUT MARKET RISK
We are exposed to market risk primarily from changes in foreign currency exchange rates and interest rates. To reduce such risks, we selectively use financial instruments and other proactive management techniques. All hedging transactions strictly prohibit the use of financial instruments for trading or speculative purposes. A discussion of our accounting policies for derivative financial instruments is included within Notes 2 and 8, of the Notes to the Consolidated Financial Statements included in this Annual Report.
Interest Rate Risk
Our exposure to interest rate risk results from variable debt outstanding under our term loan and revolving credit facility with PNC Bank. We pay interest on outstanding borrowings at interest rates that fluctuate based upon changes in various base rates. As of December 29, 2018, we had $255.8 million in borrowings outstanding under the revolving credit facility and $96.3 million in borrowings outstanding under the term loan. Based on our level of variable rate debt outstanding during the year ended December 29, 2018, a one percentage point increase in the weighted average interest rate, which generally equals 4.01%, would have resulted in an approximate $2.2 million increase in financing costs for the year ended December 29, 2018.
Foreign Currency Risk
Our exposure to foreign currency exchange fluctuations relate primarily to our locations in Italy, Australia, Germany, South Korea, the United Kingdom, China and India. Our operations in these countries are exposed to fluctuations in foreign currency rates primarily from payments received from customers and payments made to suppliers denominated in foreign currencies. During the year ended December 29, 2018 we economically hedged certain foreign currency risks by entering into forward foreign exchange contracts. These contracts were not designated as hedging instruments for accounting purposes. A discussion of our accounting policies for derivative financial instruments is included within Notes 2 and 8, of the Notes to the Consolidated Financial Statements included in this Annual Report.
The strengthening of the U.S. dollar can have an unfavorable impact on our results of operations and financial position as foreign denominated operating results are translated into U.S. dollars. The result of a 10% decrease in the 2018 average exchange rates of the currencies in which our transactions are denominated would have resulted in a decrease in annual sales and net income of $17.1 million and $1.6 million, respectively, for the year ended December 29, 2018. This sensitivity analysis assumes that each exchange rate changed in the same direction relative to the U.S. dollar and excludes the potential effects that changes in foreign currency exchange rates may have on actual sales or price levels. Similarly, a 10% decline in foreign currency exchange rates relative to the U.S. dollar on our December 29, 2018 financial position would have resulted in a $46.3 million reduction to equity (accumulated other comprehensive loss), as a result of non U.S. dollar denominated assets and liabilities being translated into U.S. dollars, our reporting currency.
53
ITEM 8. FINANCIAL STATEMENTS AND SUPPLEMENTARY DATA
|
|
|
Page |
|
Index to financial statements: |
|
|
|
|
|
|
|
|
55 |
|
|
|
|
|
|
Consolidated Balance Sheets as of December 29, 2018 and December 30, 2017 |
|
58 |
|
|
|
|
|
|
59 |
|
|
|
|
|
|
|
60 |
|
|
|
|
|
|
|
61 |
|
|
|
|
|
|
|
62 |
|
|
|
|
|
|
|
64 |
54
Report of Independent Registered Public Accounting Firm
Board of Directors and Shareholders
Sun Hydraulics Corporation, doing business as Helios Technologies
Opinion on the financial statements
We have audited the accompanying consolidated balance sheets of Sun Hydraulics Corporation, doing business as Helios Technologies, (a Florida Corporation) and subsidiaries (the “Company”) as of December 29, 2018 and December 30, 2017, the related consolidated statements of operations, comprehensive income, shareholders’ equity, and cash flows for each of the three years in the periods ended December 29, 2018, December 30, 2017, and December 31, 2016, and the related notes (collectively referred to as the “financial statements”). In our opinion, the financial statements present fairly, in all material respects, the financial position of the Company as of December 29, 2018, and December 30, 2017, and the results of its operations and its cash flows for each of the three years in the periods ended December 29, 2018, December 30, 2017, and December 31, 2016, in conformity with accounting principles generally accepted in the United States of America.
We also have audited, in accordance with the standards of the Public Company Accounting Oversight Board (United States) (“PCAOB”), the Company’s internal control over financial reporting as of December 29, 2018, based on criteria established in the 2013 Internal Control—Integrated Framework issued by the Committee of Sponsoring Organizations of the Treadway Commission (“COSO”), and our report dated February 26, 2019 expressed an unqualified opinion.
Basis for opinion
These financial statements are the responsibility of the Company’s management. Our responsibility is to express an opinion on the Company’s financial statements based on our audits. We are a public accounting firm registered with the PCAOB and are required to be independent with respect to the Company in accordance with the U.S. federal securities laws and the applicable rules and regulations of the Securities and Exchange Commission and the PCAOB.
We conducted our audits in accordance with the standards of the PCAOB. Those standards require that we plan and perform the audit to obtain reasonable assurance about whether the financial statements are free of material misstatement, whether due to error or fraud. Our audits included performing procedures to assess the risks of material misstatement of the financial statements, whether due to error or fraud, and performing procedures that respond to those risks. Such procedures included examining, on a test basis, evidence supporting the amounts and disclosures in the financial statements. Our audits also included evaluating the accounting principles used and significant estimates made by management, as well as evaluating the overall presentation of the financial statements. We believe that our audits provide a reasonable basis for our opinion.
/s/ GRANT THORNTON LLP
We have served as the Company’s auditor since 2016.
Tampa, Florida
February 26, 2019
55
Report of Independent Registered Public Accounting Firm
Board of Directors and Shareholders
Sun Hydraulics Corporation, doing business as Helios Technologies
Opinion on internal control over financial reporting
We have audited the internal control over financial reporting of Sun Hydraulics Corporation, doing business as Helios Technologies, (a Florida Corporation) and subsidiaries (the “Company”) as of December 29, 2018, based on criteria established in the 2013 Internal Control—Integrated Framework issued by the Committee of Sponsoring Organizations of the Treadway Commission (“COSO”). In our opinion, the Company maintained, in all material respects, effective internal control over financial reporting as of December 29, 2018, based on criteria established in the 2013 Internal Control—Integrated Framework issued by COSO.
We also have audited, in accordance with the standards of the Public Company Accounting Oversight Board (United States) (“PCAOB”), the consolidated financial statements of the Company as of and for the year ended December 29, 2018, and our report dated February 26, 2019 expressed an unqualified opinion on those financial statements.
Basis for opinion
The Company’s management is responsible for maintaining effective internal control over financial reporting and for its assessment of the effectiveness of internal control over financial reporting, included in the accompanying Management’s Report on Internal Control over Financial Reporting. Our responsibility is to express an opinion on the Company’s internal control over financial reporting based on our audit. We are a public accounting firm registered with the PCAOB and are required to be independent with respect to the Company in accordance with the U.S. federal securities laws and the applicable rules and regulations of the Securities and Exchange Commission and the PCAOB.
We conducted our audit in accordance with the standards of the PCAOB. Those standards require that we plan and perform the audit to obtain reasonable assurance about whether effective internal control over financial reporting was maintained in all material respects. Our audit included obtaining an understanding of internal control over financial reporting, assessing the risk that a material weakness exists, testing and evaluating the design and operating effectiveness of internal control based on the assessed risk, and performing such other procedures as we considered necessary in the circumstances. We believe that our audit provides a reasonable basis for our opinion.
Definition and limitations of internal control over financial reporting
A company’s internal control over financial reporting is a process designed to provide reasonable assurance regarding the reliability of financial reporting and the preparation of financial statements for external purposes in accordance with generally accepted accounting principles. A company’s internal control over financial reporting includes those policies and procedures that (1) pertain to the maintenance of records that, in reasonable detail, accurately and fairly reflect the transactions and dispositions of the assets of the company; (2) provide reasonable assurance that transactions are recorded as necessary to permit preparation of financial statements in accordance with generally accepted accounting principles, and that receipts and expenditures of the company are being made only in accordance with authorizations of management and directors of the company; and (3) provide reasonable assurance regarding prevention or timely detection of unauthorized acquisition, use, or disposition of the company’s assets that could have a material effect on the financial statements.
56
Because of its inherent limitations, internal control over financial reporting may not prevent or detect misstatements. Also, projections of any evaluation of effectiveness to future periods are subject to the risk that controls may become inadequate because of changes in conditions, or that the degree of compliance with the policies or procedures may deteriorate.
/s/ GRANT THORNTON LLP
Tampa, Florida
February 26, 2019
57
Doing Business as Helios Technologies
(in thousands, except share data)
|
|
|
December 29, 2018 |
|
|
December 30, 2017 |
|
||
|
Assets |
|
|
|
|
|
|
|
|
|
Current assets: |
|
|
|
|
|
|
|
|
|
Cash and cash equivalents |
|
$ |
23,477 |
|
|
$ |
63,882 |
|
|
Restricted cash |
|
|
38 |
|
|
|
40 |
|
|
Accounts receivable, net of allowance for doubtful accounts of $1,336 and $358 |
|
|
72,806 |
|
|
|
37,503 |
|
|
Inventories, net |
|
|
85,989 |
|
|
|
41,545 |
|
|
Income taxes receivable |
|
|
4,549 |
|
|
|
— |
|
|
Other current assets |
|
|
9,997 |
|
|
|
3,806 |
|
|
Total current assets |
|
|
196,856 |
|
|
|
146,776 |
|
|
Property, plant and equipment, net |
|
|
126,868 |
|
|
|
91,931 |
|
|
Deferred income taxes |
|
|
9,463 |
|
|
|
4,654 |
|
|
Goodwill |
|
|
383,131 |
|
|
|
108,869 |
|
|
Other intangibles, net |
|
|
320,548 |
|
|
|
104,131 |
|
|
Other assets |
|
|
5,299 |
|
|
|
3,405 |
|
|
Total assets |
|
$ |
1,042,165 |
|
|
$ |
459,766 |
|
|
Liabilities and shareholders' equity |
|
|
|
|
|
|
|
|
|
Current liabilities: |
|
|
|
|
|
|
|
|
|
Accounts payable |
|
$ |
40,879 |
|
|
$ |
15,469 |
|
|
Accrued compensation and benefits |
|
|
13,260 |
|
|
|
3,932 |
|
|
Other accrued expenses and current liabilities |
|
|
9,941 |
|
|
|
5,045 |
|
|
Current portion of contingent consideration |
|
|
18,120 |
|
|
|
17,102 |
|
|
Current portion of long-term non-revolving debt, net |
|
|
5,215 |
|
|
|
— |
|
|
Dividends payable |
|
|
2,878 |
|
|
|
2,437 |
|
|
Income taxes payable |
|
|
2,697 |
|
|
|
1,878 |
|
|
Total current liabilities |
|
|
92,990 |
|
|
|
45,863 |
|
|
Revolving line of credit |
|
|
255,750 |
|
|
|
116,000 |
|
|
Long-term non-revolving debt, net |
|
|
91,720 |
|
|
|
— |
|
|
Contingent consideration, less current portion |
|
|
840 |
|
|
|
16,780 |
|
|
Deferred income taxes |
|
|
57,783 |
|
|
|
2,068 |
|
|
Other noncurrent liabilities |
|
|
12,314 |
|
|
|
6,382 |
|
|
Total liabilities |
|
|
511,397 |
|
|
|
187,093 |
|
|
Commitments and contingencies |
|
|
— |
|
|
|
— |
|
|
Shareholders' equity: |
|
|
|
|
|
|
|
|
|
Preferred stock, 2,000,000 shares authorized, par value $0.001, no shares outstanding |
|
|
— |
|
|
|
— |
|
|
Common stock, 50,000,000 shares authorized, par value $0.001, 31,964,775 and 27,077,145 shares outstanding |
|
|
32 |
|
|
|
27 |
|
|
Capital in excess of par value |
|
|
357,933 |
|
|
|
95,354 |
|
|
Retained earnings |
|
|
219,056 |
|
|
|
183,770 |
|
|
Accumulated other comprehensive loss |
|
|
(46,253 |
) |
|
|
(6,478 |
) |
|
Total shareholders' equity |
|
|
530,768 |
|
|
|
272,673 |
|
|
Total liabilities and shareholders' equity |
|
$ |
1,042,165 |
|
|
$ |
459,766 |
|
The accompanying Notes to the Consolidated Financial Statements are an integral part of these financial statements.
58
Doing Business as Helios Technologies
Consolidated Statements of Operations
(in thousands, except per share data)
|
|
|
For the year ended |
|
|||||||||
|
|
|
December 29, 2018 |
|
|
December 30, 2017 |
|
|
December 31, 2016 |
|
|||
|
|
|
|
|
|
|
|
|
|
|
|
|
|
|
|
|
|
|
|
|
|
|
|
|
|
|
|
|
Net sales |
|
$ |
508,045 |
|
|
$ |
342,839 |
|
|
$ |
196,934 |
|
|
Cost of sales |
|
|
315,362 |
|
|
|
206,314 |
|
|
|
125,585 |
|
|
Gross profit |
|
|
192,683 |
|
|
|
136,525 |
|
|
|
71,349 |
|
|
Selling, engineering and administrative expenses |
|
|
93,867 |
|
|
|
65,580 |
|
|
|
35,345 |
|
|
Restructuring charges |
|
|
— |
|
|
|
1,031 |
|
|
|
— |
|
|
Amortization of intangible assets |
|
|
23,262 |
|
|
|
8,423 |
|
|
|
1,545 |
|
|
Operating income |
|
|
75,554 |
|
|
|
61,491 |
|
|
|
34,459 |
|
|
Interest expense (income), net |
|
|
13,876 |
|
|
|
3,781 |
|
|
|
(790 |
) |
|
Foreign currency transaction loss (gain), net |
|
|
3,558 |
|
|
|
(52 |
) |
|
|
(395 |
) |
|
Miscellaneous expense, net |
|
|
243 |
|
|
|
742 |
|
|
|
743 |
|
|
Change in fair value of contingent consideration |
|
|
1,482 |
|
|
|
9,476 |
|
|
|
— |
|
|
Income before income taxes |
|
|
56,395 |
|
|
|
47,544 |
|
|
|
34,901 |
|
|
Income tax provision |
|
|
9,665 |
|
|
|
15,986 |
|
|
|
11,597 |
|
|
Net income |
|
$ |
46,730 |
|
|
$ |
31,558 |
|
|
$ |
23,304 |
|
|
Basic and diluted net income per common share |
|
$ |
1.49 |
|
|
$ |
1.17 |
|
|
$ |
0.87 |
|
|
Basic and diluted weighted average shares outstanding |
|
|
31,309 |
|
|
|
27,031 |
|
|
|
26,892 |
|
|
Dividends declared per share |
|
$ |
0.36 |
|
|
$ |
0.38 |
|
|
$ |
0.40 |
|
The accompanying Notes to the Consolidated Financial Statements are an integral part of these financial statements.
59
Doing Business as Helios Technologies
Consolidated Statements of Comprehensive Income
(in thousands)
|
|
|
For the year ended |
|
|||||||||
|
|
|
December 29, 2018 |
|
|
December 30, 2017 |
|
|
December 31, 2016 |
|
|||
|
Net income |
|
$ |
46,730 |
|
|
$ |
31,558 |
|
|
$ |
23,304 |
|
|
Other comprehensive (loss) income |
|
|
|
|
|
|
|
|
|
|
|
|
|
Foreign currency translation adjustments |
|
|
(37,466 |
) |
|
|
8,964 |
|
|
|
(6,661 |
) |
|
Unrealized gain on available-for-sale securities |
|
|
— |
|
|
|
391 |
|
|
|
871 |
|
|
Unrealized loss on interest rate swap |
|
|
(2,309 |
) |
|
|
— |
|
|
|
— |
|
|
Total other comprehensive (loss) income |
|
|
(39,775 |
) |
|
|
9,355 |
|
|
|
(5,790 |
) |
|
Comprehensive income |
|
$ |
6,955 |
|
|
$ |
40,913 |
|
|
$ |
17,514 |
|
The accompanying Notes to the Consolidated Financial Statements are an integral part of these financial statements.
60
Doing Business as Helios Technologies
Consolidated Statements of Shareholders’ Equity
(in thousands)
|
|
|
|
|
|
|
|
|
|
|
|
|
|
|
|
|
|
|
|
|
|
|
|
|
|
|
Accumulated |
|
|
|
|
|
|
|
|
|
|
|
|
|
|
|
|
|
|
|
|
|
|
|
|
|
Capital in |
|
|
|
|
|
|
other |
|
|
|
|
|
||
|
|
|
Preferred |
|
|
Preferred |
|
|
Common |
|
|
Common |
|
|
excess of |
|
|
Retained |
|
|
comprehensive |
|
|
|
|
|
|||||||
|
|
|
shares |
|
|
stock |
|
|
shares |
|
|
stock |
|
|
par value |
|
|
earnings |
|
|
income (loss) |
|
|
Total |
|
||||||||
|
Balance, January 2, 2016 |
|
|
— |
|
|
$ |
— |
|
|
|
26,786 |
|
|
$ |
27 |
|
|
$ |
82,265 |
|
|
$ |
149,938 |
|
|
$ |
(10,043 |
) |
|
$ |
222,187 |
|
|
Shares issued, restricted stock |
|
|
|
|
|
|
|
|
|
|
40 |
|
|
|
|
|
|
|
|
|
|
|
|
|
|
|
|
|
|
|
— |
|
|
Shares issued, other compensation |
|
|
|
|
|
|
|
|
|
|
25 |
|
|
|
|
|
|
|
|
|
|
|
|
|
|
|
|
|
|
|
— |
|
|
Shares issued, ESPP |
|
|
|
|
|
|
|
|
|
|
34 |
|
|
|
|
|
|
|
1,039 |
|
|
|
|
|
|
|
|
|
|
|
1,039 |
|
|
Shares issued, shared distribution |
|
|
|
|
|
|
|
|
|
|
51 |
|
|
|
|
|
|
|
1,679 |
|
|
|
|
|
|
|
|
|
|
|
1,679 |
|
|
Stock-based compensation |
|
|
|
|
|
|
|
|
|
|
|
|
|
|
|
|
|
|
4,848 |
|
|
|
|
|
|
|
|
|
|
|
4,848 |
|
|
Tax expense of stock-based compensation |
|
|
|
|
|
|
|
|
|
|
|
|
|
|
|
|
|
|
(113 |
) |
|
|
|
|
|
|
|
|
|
|
(113 |
) |
|
Dividends declared |
|
|
|
|
|
|
|
|
|
|
|
|
|
|
|
|
|
|
|
|
|
|
(10,757 |
) |
|
|
|
|
|
|
(10,757 |
) |
|
Net income |
|
|
|
|
|
|
|
|
|
|
|
|
|
|
|
|
|
|
|
|
|
|
23,304 |
|
|
|
|
|
|
|
23,304 |
|
|
Other comprehensive loss |
|
|
|
|
|
|
|
|
|
|
|
|
|
|
|
|
|
|
|
|
|
|
|
|
|
|
(5,790 |
) |
|
|
(5,790 |
) |
|
Balance, December 31, 2016 |
|
|
— |
|
|
$ |
— |
|
|
|
26,936 |
|
|
$ |
27 |
|
|
$ |
89,718 |
|
|
$ |
162,485 |
|
|
$ |
(15,833 |
) |
|
$ |
236,397 |
|
|
Shares issued, restricted stock |
|
|
|
|
|
|
|
|
|
|
67 |
|
|
|
|
|
|
|
|
|
|
|
|
|
|
|
|
|
|
|
— |
|
|
Shares issued, other compensation |
|
|
|
|
|
|
|
|
|
|
26 |
|
|
|
|
|
|
|
|
|
|
|
|
|
|
|
|
|
|
|
— |
|
|
Shares issued, ESPP |
|
|
|
|
|
|
|
|
|
|
31 |
|
|
|
|
|
|
|
1,156 |
|
|
|
|
|
|
|
|
|
|
|
1,156 |
|
|
Shares issued, shared distribution |
|
|
|
|
|
|
|
|
|
|
17 |
|
|
|
|
|
|
|
628 |
|
|
|
|
|
|
|
|
|
|
|
628 |
|
|
Stock-based compensation |
|
|
|
|
|
|
|
|
|
|
|
|
|
|
|
|
|
|
3,852 |
|
|
|
|
|
|
|
|
|
|
|
3,852 |
|
|
Dividends declared |
|
|
|
|
|
|
|
|
|
|
|
|
|
|
|
|
|
|
|
|
|
|
(10,273 |
) |
|
|
|
|
|
|
(10,273 |
) |
|
Net income |
|
|
|
|
|
|
|
|
|
|
|
|
|
|
|
|
|
|
|
|
|
|
31,558 |
|
|
|
|
|
|
|
31,558 |
|
|
Other comprehensive income |
|
|
|
|
|
|
|
|
|
|
|
|
|
|
|
|
|
|
|
|
|
|
|
|
|
|
9,355 |
|
|
|
9,355 |
|
|
Balance, December 30, 2017 |
|
|
— |
|
|
$ |
— |
|
|
|
27,077 |
|
|
$ |
27 |
|
|
$ |
95,354 |
|
|
$ |
183,770 |
|
|
$ |
(6,478 |
) |
|
$ |
272,673 |
|
|
Shares issued, restricted stock |
|
|
|
|
|
|
|
|
|
|
102 |
|
|
|
|
|
|
|
|
|
|
|
|
|
|
|
|
|
|
|
— |
|
|
Shares issued, other compensation |
|
|
|
|
|
|
|
|
|
|
24 |
|
|
|
|
|
|
|
|
|
|
|
|
|
|
|
|
|
|
|
— |
|
|
Shares issued, ESPP |
|
|
|
|
|
|
|
|
|
|
36 |
|
|
|
|
|
|
|
1,546 |
|
|
|
|
|
|
|
|
|
|
|
1,546 |
|
|
Shares issued, public offering |
|
|
|
|
|
|
|
|
|
|
4,400 |
|
|
|
5 |
|
|
|
239,788 |
|
|
|
|
|
|
|
|
|
|
|
239,793 |
|
|
Shares issued, acquisition |
|
|
|
|
|
|
|
|
|
|
333 |
|
|
|
|
|
|
|
17,339 |
|
|
|
|
|
|
|
|
|
|
|
17,339 |
|
|
Stock-based compensation |
|
|
|
|
|
|
|
|
|
|
|
|
|
|
|
|
|
|
4,271 |
|
|
|
|
|
|
|
|
|
|
|
4,271 |
|
|
Cancellation of shares for payment of employee tax withholding |
|
|
|
|
|
|
|
|
|
|
(7 |
) |
|
|
|
|
|
|
(365 |
) |
|
|
|
|
|
|
|
|
|
|
(365 |
) |
|
Dividends declared |
|
|
|
|
|
|
|
|
|
|
|
|
|
|
|
|
|
|
|
|
|
|
(11,444 |
) |
|
|
|
|
|
|
(11,444 |
) |
|
Net income |
|
|
|
|
|
|
|
|
|
|
|
|
|
|
|
|
|
|
|
|
|
|
46,730 |
|
|
|
|
|
|
|
46,730 |
|
|
Other comprehensive loss |
|
|
|
|
|
|
|
|
|
|
|
|
|
|
|
|
|
|
|
|
|
|
|
|
|
|
(39,775 |
) |
|
|
(39,775 |
) |
|
Balance, December 29, 2018 |
|
|
— |
|
|
$ |
— |
|
|
|
31,965 |
|
|
$ |
32 |
|
|
$ |
357,933 |
|
|
$ |
219,056 |
|
|
$ |
(46,253 |
) |
|
$ |
530,768 |
|
The accompanying Notes to the Consolidated Financial Statements are an integral part of these financial statements.
61
Doing Business as Helios Technologies
Consolidated Statements of Cash Flows
(in thousands)
|
|
|
For the year ended |
|
|||||||||
|
|
|
December 29, 2018 |
|
|
December 30, 2017 |
|
|
December 31, 2016 |
|
|||
|
Cash flows from operating activities: |
|
|
|
|
|
|
|
|
|
|
|
|
|
Net income |
|
$ |
46,730 |
|
|
$ |
31,558 |
|
|
$ |
23,304 |
|
|
Adjustments to reconcile net income to net cash provided by operating activities: |
|
|
|
|
|
|
|
|
|
|
|
|
|
Depreciation and amortization |
|
|
39,714 |
|
|
|
19,190 |
|
|
|
11,318 |
|
|
Loss on disposal of assets |
|
|
56 |
|
|
|
1,539 |
|
|
|
329 |
|
|
Stock-based compensation expense |
|
|
4,271 |
|
|
|
4,042 |
|
|
|
4,848 |
|
|
Amortization of debt issuance costs |
|
|
729 |
|
|
|
334 |
|
|
|
47 |
|
|
(Benefit) provision for deferred income taxes |
|
|
(1,455 |
) |
|
|
(6,791 |
) |
|
|
77 |
|
|
Amortization of acquisition-related inventory step-up |
|
|
4,441 |
|
|
|
1,774 |
|
|
|
1,021 |
|
|
Change in fair value of contingent consideration |
|
|
1,482 |
|
|
|
9,476 |
|
|
|
— |
|
|
Non-cash restructuring and related charges |
|
|
— |
|
|
|
390 |
|
|
|
— |
|
|
Forward contract losses, net |
|
|
3,496 |
|
|
|
— |
|
|
|
— |
|
|
Other, net |
|
|
(86 |
) |
|
|
318 |
|
|
|
179 |
|
|
(Increase) decrease in, net of acquisitions: |
|
|
|
|
|
|
|
|
|
|
|
|
|
Accounts receivable |
|
|
(5,976 |
) |
|
|
(11,063 |
) |
|
|
(3,158 |
) |
|
Inventories |
|
|
(11,703 |
) |
|
|
(13,063 |
) |
|
|
(1,380 |
) |
|
Income taxes receivable |
|
|
(4,054 |
) |
|
|
512 |
|
|
|
(1,628 |
) |
|
Other current assets |
|
|
565 |
|
|
|
254 |
|
|
|
(153 |
) |
|
Other assets |
|
|
(1,299 |
) |
|
|
(820 |
) |
|
|
(106 |
) |
|
Increase (decrease) in, net of acquisitions: |
|
|
|
|
|
|
|
|
|
|
|
|
|
Accounts payable |
|
|
5,894 |
|
|
|
5,780 |
|
|
|
2,566 |
|
|
Accrued expenses and other liabilities |
|
|
(1,400 |
) |
|
|
1,497 |
|
|
|
656 |
|
|
Income taxes payable |
|
|
(5,031 |
) |
|
|
3,404 |
|
|
|
838 |
|
|
Other noncurrent liabilities |
|
|
1,076 |
|
|
|
1,051 |
|
|
|
(252 |
) |
|
Net cash provided by operating activities |
|
|
77,450 |
|
|
|
49,382 |
|
|
|
38,506 |
|
|
Cash flows from investing activities: |
|
|
|
|
|
|
|
|
|
|
|
|
|
Acquisitions of businesses, net of cash acquired |
|
|
(534,662 |
) |
|
|
(500 |
) |
|
|
(200,056 |
) |
|
Investment in licensed technology |
|
|
— |
|
|
|
— |
|
|
|
(1,227 |
) |
|
Capital expenditures |
|
|
(28,380 |
) |
|
|
(22,205 |
) |
|
|
(6,187 |
) |
|
Proceeds from dispositions of equipment |
|
|
62 |
|
|
|
47 |
|
|
|
7 |
|
|
Purchases of short-term investments |
|
|
— |
|
|
|
— |
|
|
|
(24,699 |
) |
|
Proceeds from sale of short-term investments |
|
|
— |
|
|
|
6,684 |
|
|
|
62,374 |
|
|
Cash settlement of forward contract |
|
|
(2,535 |
) |
|
|
— |
|
|
|
— |
|
|
Net cash used in investing activities |
|
|
(565,515 |
) |
|
|
(15,974 |
) |
|
|
(169,788 |
) |
62
|
Cash flows from financing activities: |
|
|
|
|
|
|
|
|
|
|
|
|
|
Borrowings on revolving credit facility |
|
|
282,500 |
|
|
|
— |
|
|
|
140,000 |
|
|
Repayment of borrowings on revolving credit facility |
|
|
(142,750 |
) |
|
|
(24,000 |
) |
|
|
— |
|
|
Borrowings on long-term non-revolving debt |
|
|
101,447 |
|
|
|
— |
|
|
|
— |
|
|
Repayment of borrowings on long-term non-revolving debt |
|
|
(3,825 |
) |
|
|
— |
|
|
|
— |
|
|
Borrowings under factoring arrangements |
|
|
3,184 |
|
|
|
— |
|
|
|
— |
|
|
Repayment of borrowings under factoring arrangements |
|
|
(3,120 |
) |
|
|
— |
|
|
|
— |
|
|
Payments on capital lease obligations |
|
|
(961 |
) |
|
|
— |
|
|
|
— |
|
|
Stock compensation income tax expense |
|
|
— |
|
|
|
— |
|
|
|
(113 |
) |
|
Proceeds from stock issued |
|
|
241,338 |
|
|
|
1,156 |
|
|
|
1,039 |
|
|
Dividends to shareholders |
|
|
(11,003 |
) |
|
|
(10,260 |
) |
|
|
(10,744 |
) |
|
Debt issuance costs |
|
|
(1,763 |
) |
|
|
— |
|
|
|
(1,959 |
) |
|
Payment of employee tax withholding |
|
|
(365 |
) |
|
|
— |
|
|
|
— |
|
|
Payment of contingent consideration liability |
|
|
(17,342 |
) |
|
|
(16,985 |
) |
|
|
— |
|
|
Net cash provided by (used in) financing activities |
|
|
447,340 |
|
|
|
(50,089 |
) |
|
|
128,223 |
|
|
Effect of exchange rate changes on cash, cash equivalents and restricted cash |
|
|
318 |
|
|
|
6,345 |
|
|
|
(4,659 |
) |
|
Net decrease in cash, cash equivalents and restricted cash |
|
|
(40,407 |
) |
|
|
(10,336 |
) |
|
|
(7,718 |
) |
|
Cash, cash equivalents and restricted cash, beginning of period |
|
|
63,922 |
|
|
|
74,258 |
|
|
|
81,976 |
|
|
Cash, cash equivalents and restricted cash, end of period |
|
$ |
23,515 |
|
|
$ |
63,922 |
|
|
$ |
74,258 |
|
|
Supplemental disclosure of cash flow information: |
|
|
|
|
|
|
|
|
|
|
|
|
|
Cash paid: |
|
|
|
|
|
|
|
|
|
|
|
|
|
Income taxes |
|
$ |
20,227 |
|
|
$ |
17,470 |
|
|
$ |
12,785 |
|
|
Interest |
|
$ |
12,783 |
|
|
$ |
3,723 |
|
|
$ |
364 |
|
|
Supplemental disclosure of noncash transactions: |
|
|
|
|
|
|
|
|
|
|
|
|
|
Common stock issued for shared distribution through accrued expenses and other liabilities |
|
$ |
— |
|
|
$ |
628 |
|
|
$ |
1,679 |
|
|
Unrealized gain on available for sale securities |
|
$ |
— |
|
|
$ |
391 |
|
|
$ |
871 |
|
|
Unrealized loss on interest rate swap |
|
$ |
(2,309 |
) |
|
$ |
— |
|
|
$ |
— |
|
|
Contingent consideration incurred in connection with acquisition |
|
$ |
938 |
|
|
$ |
— |
|
|
$ |
35,077 |
|
|
Measurement period adjustment to goodwill and contingent consideration |
|
$ |
— |
|
|
$ |
4,504 |
|
|
$ |
— |
|
|
Stock issued for acquisition |
|
$ |
17,339 |
|
|
$ |
— |
|
|
$ |
— |
|
The accompanying Notes to the Consolidated Financial Statements are an integral part of these financial statements.
63
Doing Business as Helios Technologies
NOTES TO THE CONSOLIDATED FINANCIAL STATEMENTS
(Dollars in thousands, except per share data)
Sun Hydraulics Corporation, doing business as Helios Technologies (“Helios” or the “Company”), and its wholly-owned subsidiaries, is an industrial technology leader that develops and manufactures solutions for both the hydraulics and electronics markets. On August 6, 2018, the Company announced that it had adopted Helios Technologies as its business name. Sun Hydraulics, LLC, a newly-formed Florida limited liability company that holds the historical net operating assets of the Sun Hydraulics brand entities and Custom Fluidpower, along with Enovation Controls, LLC and Faster S.r.l. are the wholly-owned operating subsidiaries of Helios Technologies under the new holding company name.
The Company operates in two business segments: Hydraulics and Electronics. The Hydraulics segment consists of the global Sun Hydraulics companies, Faster, acquired in the second quarter of this fiscal year, and Custom Fluidpower, acquired in the third quarter of this fiscal year. Sun Hydraulics serves the hydraulics market as a leading manufacturer of high-performance screw-in hydraulic cartridge valves, electro-hydraulics, manifolds, and integrated package solutions for the worldwide industrial and mobile hydraulics markets. Faster is a leading global manufacturer of quick release hydraulic coupling solutions focused in the agriculture, construction equipment and industrial markets. Customer Fluidpower is a global provider of hydraulic, pneumatic, electronic and instrumentation solutions to a broad range of industries including agriculture, industrial, mining and material handling.
On December 29, 2017 the Company merged the operations of two of its wholly owned subsidiaries in the Electronics segment, HCT and Enovation Controls. Enovation Controls was the surviving legal entity and will continue to sell HCT products under the HCT™ brand. Enovation Controls is a global provider of innovative electronic control, display and instrumentation solutions for both recreational and off-highway vehicles, as well as stationary and power generation equipment.
2. SUMMARY OF SIGNIFICANT ACCOUNTING POLICIES
Principles of Consolidation
The consolidated financial statements include the accounts and operations of Helios Technologies and its direct subsidiaries. All significant intercompany accounts and transactions are eliminated in consolidation.
Use of Estimates
The preparation of financial statements in conformity with accounting principles generally accepted in the United States of America requires management to make estimates and assumptions that affect the reported amounts of assets and liabilities and disclosure of contingent assets and liabilities at the date of the financial statements and the reported amounts of revenues and expenses during the reporting period. Actual results could differ from those estimates.
Cash, Cash Equivalents
The Company considers all highly liquid investments purchased with an original maturity of three months or less to be cash equivalents. Cash and cash equivalents are maintained at financial institutions and, at times, balances may exceed federally insured limits. The Company has never experienced any losses related to these balances.
64
Accounts Receivable, net
Accounts receivable are stated at amounts owed by customers, net of an allowance for estimated doubtful accounts. The allowance for doubtful accounts is determined on a specific identification basis by a review of those accounts that are significantly in arrears. Account balances are charged against the allowance when it is probable the receivable will not be recovered. See the Consolidated Balance Sheets for the allowance amounts.
Inventory
Inventories are valued at the lower of cost and net realizable value, on a first-in, first-out basis. On an ongoing basis, component parts found to be obsolete through design or process changes are disposed of and charged to material cost. The Company reviews on-hand balances of products and component parts against specific criteria. Products and component parts without usage or that have excess quantities on hand are evaluated. An inventory reserve is then established for the appropriate inventory value of those products and component parts deemed to be obsolete or slow moving. See Note 5 for inventory reserve amounts.
Property, Plant and Equipment
Property, plant and equipment is stated at cost. Expenditures for repairs and improvements that significantly add to the productive capacity or extend the useful life of an asset are capitalized. Repairs and maintenance are expensed as incurred. Depreciation is computed using the straight line method over the following useful lives:
|
|
|
Years |
|
Machinery and equipment |
|
4 - 12 |
|
Office furniture and equipment |
|
3 - 10 |
|
Buildings |
|
25 - 40 |
|
Building and land improvements |
|
7 - 40 |
Gains or losses on the retirement, sale, or disposition of property, plant, and equipment are reflected in the Consolidated Statement of Operations in the period in which the assets are taken out of service.
Fair Value Measurements
The Company applies fair value accounting guidelines for all financial assets and liabilities and non-financial assets and liabilities that are recognized or disclosed at fair value in the financial statements on a recurring basis (at least annually). Under these guidelines, fair value is defined as the price that would be received for the sale of an asset or paid to transfer a liability (i.e., an exit price) in an orderly transaction between market participants at the measurement date. The guidance establishes a three-tier fair value hierarchy which prioritizes the inputs used in measuring fair value as follows:
Level 1 - Quoted prices in active markets for identical assets or liabilities.
Level 2 - Observable inputs other than quoted prices included in Level 1, such as quoted prices for similar assets or liabilities in active markets or quoted prices for identical assets or liabilities in inactive markets.
Level 3 - Unobservable inputs that are supported by little, infrequent, or no market activity and reflect the Company’s own assumptions about inputs used in pricing the asset or liability.
The fair value hierarchy also requires an entity to maximize the use of observable inputs and minimize the use of unobservable inputs when measuring fair value.
65
The fair value of the Company’s cash and cash equivalents, accounts receivable, other current assets, accounts payable, accrued expenses and other liabilities approximate their carrying value, due to their short-term nature. Contingent consideration and newly acquired intangible assets are measured at fair value using level 3 inputs. The Company utilizes risk-adjusted probability analysis to estimate the fair value of contingent consideration arrangements. Forward foreign exchange contracts are measured at fair value based on quoted foreign exchange forward rates at the reporting dates. The fair value of interest rate swap contracts is based on the expected cash flows over the life of the trade. Expected cash flows are determined by evaluating transactions with a pricing model using a specific market environment. The values are estimated using the closing and mid-market market rate/price environment as of the end of the period. See Note 4 for detail on the level of inputs used in determining the fair value of assets and liabilities.
Business Combinations
Business combinations are accounted for under the acquisition method of accounting, which requires recognition separately from goodwill, the assets acquired and the liabilities assumed at their acquisition date fair values. While best estimates and assumptions are used to accurately value assets acquired and liabilities assumed at the acquisition date as well as contingent consideration, when applicable, the estimates are inherently uncertain and subject to refinement. As a result, during the measurement period, which may be up to one year from the acquisition date, adjustments that are based on new information obtained about facts and circumstances that existed as of the acquisition date are recorded to the assets acquired and liabilities assumed with the corresponding offset to goodwill. Upon the conclusion of the measurement period or final determination of the values of assets acquired or liabilities assumed, whichever comes first, any subsequent adjustments are recognized in the Consolidated Statements of Operations.
Goodwill and Other Intangible Assets
Goodwill, which represents the excess of the purchase price of an acquisition over the fair value of the net assets acquired, is carried at cost. Goodwill is tested for impairment annually, in the third and fourth quarters, or more frequently if events or circumstances indicate a reduction in the fair value below the carrying value. As part of the impairment test, the Company has the option to first assess qualitative factors to determine whether the existence of events or circumstances leads to a determination that it is more likely than not that the fair value of a reporting unit is less than its carrying amount. If after this optional qualitative assessment, the Company determines that impairment is more likely than not, then the Company performs the quantitative impairment test. The carrying value of assets is calculated at the reporting unit level. An impairment loss is recorded to the extent that the fair value of the goodwill within the reporting unit is less than its carrying value.
The Company completed its annual goodwill impairment testing and determined that the carrying amount of goodwill was not impaired. See Note 7 for goodwill amounts.
Other intangible assets with definite lives consist primarily of technology, customer relationships, trade names and brands and a favorable supply agreement, and are amortized over their respective estimated useful lives, ranging from one to twenty-six years.
Impairment of Long-Lived Assets
Long-lived assets, such as property and equipment, and purchased intangibles subject to amortization, are reviewed for impairment whenever events or changes in circumstances indicate that the carrying amount of an asset may not be recoverable. Recoverability of the asset is measured by comparison of its carrying amount to future net cash flows the asset is expected to generate. If such assets are considered impaired, the impairment to be recognized is measured as the amount by which the carrying amount of the asset exceeds its fair value.
66
Accrued Expenses and Other Liabilities
The Company makes estimates related to certain employee benefits and miscellaneous accruals. Estimates for employee benefit accruals are based on management’s assessment of estimated liabilities related to workers’ compensation and health care benefits. Estimates for miscellaneous accruals are based on management’s assessment of estimated liabilities for costs incurred.
The Company accrues for the estimated cost of product warranties at the time revenue is recognized. The estimates are based upon current and historical warranty trends and other related information known to the Company.
Revenue Recognition
In May 2014, the FASB issued ASU 2014-09, Revenue from Contracts with Customers. Subsequent updates to the guidance were issued in 2016. The core principle of the new guidance is that an entity will recognize revenue to depict the transfer of promised goods or services to customers in an amount that reflects the consideration to which the entity expects to be entitled in exchange for those goods and services. The standard provides a five-step analysis of transactions to determine the amount and timing of revenue to be recognized. Additionally, the guidance requires disaggregated disclosures related to the nature, amount, timing, and uncertainty of revenue that is recognized. The Company adopted the standard for the fiscal year beginning December 31, 2017, using the cumulative catch-up transition method. The adoption of this guidance did not have a material impact on the Company’s consolidated financial position, results of operations or cash flows.
Revenue recognition is evaluated through the following five steps: 1) identification of the contracts with customers; 2) identification of the performance obligations in the contracts; 3) determination of the transaction price; 4) allocation of the transaction price to the performance obligations in the contract; and 5) recognition of revenue as or when performance obligations are satisfied.
The Company disaggregates revenue by reporting segment as well as by geographic destination of the sale. See disaggregated revenue balances in Note 17, Segment Reporting. These categories depict how the nature, amount, timing and uncertainty of revenue and cash flows are affected by economic factors.
Revenue from Product Sales
The significant majority of the Company’s contracts with its customers are for standard product sales under standard ship and bill arrangements. The contracts are generally accounted for as having a single performance obligation for the manufacture of product, which is considered the only distinct promise in the contract, and are short term in nature, typically completed within one quarter and not exceeding one year in duration. The transaction price is agreed upon in the contract. Revenue is recognized upon satisfaction of the performance obligation which is typically at a point in time when control is transferred to the customer. Typically, control is transferred upon shipment to the customer but can also occur upon delivery to the customer, depending on contract terms. Revenue recognition can also occur over time for these contracts when the following criteria are met: the Company has no alternative use for the product; and the Company has an enforceable right to payment (including a reasonable margin) for performance completed to date.
Revenue is recognized in an amount that reflects the consideration the Company expects to be entitled to in exchange for the goods. Consideration for product sales is primarily fixed in nature with insignificant amounts recognized for sales discounts, rebates and product returns. The Company’s estimates for sales discounts, rebates and product returns reduce revenue recognized at the time of the sale.
67
Revenue from Services
The Company generates revenue from various services provided to customers including system design, maintenance, repairs, installation and commissioning and various other services. This is not a significant revenue stream for the Company, as it represents less than 3% of total revenue. Service contracts are typically completed within one quarter and do not exceed one year in duration. These contracts are generally accounted for as having a single distinct performance obligation for the performance of the service. The transaction price is agreed upon in the contract and can be based on a fixed amount or on a time and material arrangement. Revenue is recognized over time for service contracts as the customer receives and consumes the benefits as the Company performs. The method of over time recognition considers total costs incurred to date and the applicable margin on the total expected efforts to complete the performance obligation. This input method appropriately depicts the pattern of transfer of value to the customer.
Contract Assets & Liabilities
Contract assets are recognized when the Company has a conditional right to consideration for performance completed on contracts. Contract asset balances totaled $2,851 at December 29, 2018 and are presented in Other current assets in the Consolidated Balance Sheets. Accounts receivable balances represent unconditional rights to consideration from customers and are presented separate from contract assets in the Consolidated Balance Sheets.
Contract liabilities are recognized when payment is received from customers prior to revenue being recognized. Contract liabilities totaled $138 at December 29, 2018 and are presented in Other current liabilities in the Consolidated Balance Sheets.
The timing of customer payments most often occurs after performance obligations are satisfied which results in the recognition of a contract asset.
Other Revenue Recognition Considerations
Contracts do not have significant financing components and payment terms do not exceed one year from the date of the sale. The Company does not incur significant credit losses from contracts with customers.
The Company applies the practical expedient as permitted by the Financial Accounting Standards Board, which allows the omission of certain disclosures related to remaining performance obligations, as contract duration does not exceed one year.
The Company’s warranties provide assurance that products will function as intended. Estimated costs of product warranties are recognized at the time of the sale.
The Company treats shipping and handling activities that occur after control of the product transfers as fulfillment activities, and therefore, does not account for shipping and handling costs as a separate performance obligation. Shipping and handling costs billed to customers are recorded in revenue. Shipping costs incurred by the Company are recorded in cost of goods sold.
68
Derivative Instruments
All derivative instruments are recorded gross on the Consolidated Balance Sheet at their respective fair values. The accounting for changes in the fair value of a derivative instrument depends on the intended use of the derivative, whether the Company has elected to designate a derivative in a hedging relationship and apply hedge accounting and whether the hedging relationship has satisfied the criteria necessary to apply hedge accounting. Derivatives designated and qualifying as a hedge of the exposure to variability in expected future cash flows, or other types of forecasted transactions, are considered cash flow hedges. For derivative instruments that are designated and qualify as a cash flow hedge, the effective portion of the gain or loss on the derivative instrument is initially reported as a component of accumulated other comprehensive income and is subsequently reclassified into the line item within the Consolidated Statements of Operations in which the hedged items are recorded in the same period in which the hedged item affects earnings.
The Company enters into foreign exchange currency contracts that are not designated as hedging instruments for accounting purposes. Changes in the fair value of foreign exchange currency contracts not designated as hedging instruments are recognized in earnings. Derivative financial instruments are utilized as risk management tools and are not used for trading or speculative purposes.
Foreign Currency Translation and Transactions
The financial statements of foreign subsidiaries are translated into U.S. dollars using period-end exchange rates for assets and liabilities and average exchange rates for operating results. Unrealized translation gains and losses are included in accumulated other comprehensive income (loss) in shareholders’ equity. When a transaction is denominated in a currency other than the subsidiary’s functional currency, the Company recognizes a transaction gain or loss in foreign currency transaction (gain) loss, net when the transaction is settled.
Income Taxes
The Company’s income tax policy provides for a liability approach under which deferred income taxes are provided for based upon enacted tax laws and rates applicable to the periods in which the taxes become payable. These differences result from items reported differently for financial reporting and income tax purposes, primarily depreciation, accrued expenses and reserves.
The Company reports a liability for unrecognized tax benefits resulting from uncertain tax positions taken or expected to be taken in a tax return. The Company recognizes potential interest and penalties related to its unrecognized tax benefits in income tax expense.
Research and Development
The Company conducts research and development (“R&D”) to create new products and to make improvements to products currently in use. R&D costs are charged to expense as incurred and totaled $14,122, $10,624 and $4,334 for the 2018, 2017 and 2016 fiscal years, respectively.
Stock-Based Compensation
All share-based compensation cost is measured at the grant date, based on the fair value of the award, and is recognized as an expense in earnings over the requisite service period. Forfeitures are recognized in compensation cost when they occur. Benefits or deficiencies of tax deductions in excess of recognized compensation costs are reported within operating cash flows.
Reclassifications
Certain reclassifications have been made to the prior period consolidated financial statements to conform to the current year presentation.
69
Other Recently Adopted Accounting Standards
In August 2017, the FASB issued ASU 2017-12, Targeted Improvements to Accounting for Hedging Activities. ASU 2017-12 expands and refines hedge accounting for both financial and non-financial risk components, aligns the recognition and presentation of the effects of hedging instruments and hedged items in the financial statements, and includes certain targeted improvements to ease the application of current guidance related to the assessment of hedge effectiveness. The standard is effective for annual and interim periods beginning after December 15, 2018, with early adoption permitted. The Company adopted the standard for the fiscal quarter beginning July 1, 2018. The adoption of this guidance did not have a material impact on the Company’s consolidated financial statements.
Recently Issued Accounting Standards
In January 2017, the FASB issued ASU 2017-04, Intangibles – Goodwill and Other: Simplifying the Test for Goodwill Impairment. ASU 2017-04 eliminates the second step in the goodwill impairment test, which requires an entity to determine the implied fair value of the reporting unit’s goodwill. Instead, an entity should recognize an impairment loss if the carrying value of the net assets assigned to the reporting unit exceeds the fair value of the reporting unit, with the impairment loss not to exceed the amount of goodwill allocated to the reporting unit. The standard is effective for annual and interim goodwill impairment tests conducted in fiscal years beginning after December 15, 2019, with early adoption permitted. The Company does not expect the adoption of this guidance to have a material impact on its consolidated financial statements.
In February 2016, the FASB issued ASU 2016-02, Leases. ASU 2016-02 requires an entity to recognize both assets and liabilities arising from financing and operating leases, along with additional qualitative and quantitative disclosures. The guidance is effective for reporting periods beginning after December 15, 2018, with early adoption permitted. Upon adoption, the Company will apply the new standard retrospectively at the beginning of the period of adoption through a cumulative-effect adjustment. The Company is still evaluating the impacts of this new guidance but expects the adoption of ASU 2016-02 will materially gross up its consolidated balance sheet, by approximately $14,000, with the recognition of right-of-use assets and operating lease liabilities. The impact to the Company’s Consolidated Statements of Operations and Cash Flows is not expected to be material. The new standard will also require additional disclosures for financing and operating leases.
3. BUSINESS ACQUISITIONS
Acquisition of Faster
On April 5, 2018, the Company completed the acquisition of Faster S.p.A, a worldwide leader in engineering, manufacturing, marketing and distribution of quick release hydraulic coupling solutions headquartered near Milan, Italy. Pursuant to the Share Purchase Agreement, the Company acquired all of the outstanding equity interests of Polyusus Lux IV S.a.r.l., a Luxembourg limited liability company and the owner of 100% of the share capital of Faster S.p.A. The acquisition was completed for cash consideration totaling $532,408 and was financed with cash on hand from the Company’s registered public stock offering and borrowings of $358,000 on its credit facility. Subsequent to the acquisition, the legal structure of Faster was changed to Faster S.r.l.
Faster adds adjacent hydraulics products to the Company’s portfolio of products and broadens end market reach, increasing the Company’s presence in the growing agriculture market. The results of Faster’s operations are reported in the Company’s Hydraulics segment and have been included in the consolidated financial statements since the acquisition date.
The Share Purchase Agreement allows for future payments to the sellers for certain tax benefits realized within two years of the acquisition date. The estimated fair value of the contingent liability was determined to be $938 as of the acquisition date. See Note 4 for a summary of the change in estimated fair value of the contingent liability.
70
The fair value of total purchase consideration consisted of the following:
|
Cash |
|
$ |
532,408 |
|
|
Acquisition date fair value of contingent consideration |
|
|
938 |
|
|
Total purchase consideration |
|
|
533,346 |
|
|
Less: cash acquired |
|
|
(5,265 |
) |
|
Total purchase consideration, net of cash acquired |
|
$ |
528,081 |
|
The purchase price was allocated to tangible and intangible assets acquired and liabilities assumed based on their estimated fair values. The fair value of identifiable intangible assets acquired was based on estimates and assumptions made by management at the time of the acquisition. As additional information becomes available, as of the acquisition date, management will finalize its analysis of the estimated fair value of the identified intangible assets and tax related items including the evaluation of deductibility of goodwill and valuation of deferred taxes. As management completes its evaluation, the preliminary purchase price allocation may be revised during the remainder of the measurement period (which will not exceed 12 months from the acquisition date). Any such revisions or changes to the fair values of the tangible and intangible assets acquired and liabilities assumed may be material. The preliminary allocation of the total purchase price, net of cash acquired, is as follows:
|
Accounts receivable |
|
$ |
24,638 |
|
|
Inventories |
|
|
34,835 |
|
|
Other current assets |
|
|
6,488 |
|
|
Property, plant and equipment |
|
|
20,242 |
|
|
Goodwill |
|
|
288,792 |
|
|
Intangible assets |
|
|
248,823 |
|
|
Other assets |
|
|
6,870 |
|
|
Total assets acquired |
|
|
630,688 |
|
|
Accounts payable |
|
|
(18,668 |
) |
|
Accrued expenses |
|
|
(12,223 |
) |
|
Income taxes payable |
|
|
(4,862 |
) |
|
Other current liabilities |
|
|
(1,289 |
) |
|
Other noncurrent liabilities |
|
|
(65,565 |
) |
|
Total liabilities assumed |
|
|
(102,607 |
) |
|
Fair value of net assets acquired |
|
$ |
528,081 |
|
Goodwill is primarily attributable to Faster’s assembled workforce and anticipated synergies and economies of scale expected from the operations of the combined company. The synergies include certain cost savings, operating efficiencies, and other strategic benefits projected to be achieved as a result of the acquisition.
Transaction costs of $4,271 incurred in connection with the acquisition are included in selling, engineering and administrative expenses in the Consolidated Statement of Operations for the year ended December 29, 2018.
Net sales and income before income taxes of Faster included in the Consolidated Statement of Operations for the period from the acquisition date through December 29, 2018 totaled $106,519 and $3,058, respectively. Included in Faster’s income for the period are $4,115 of charges related to the purchase accounting effects of inventory step up to fair value and $14,297 of amortization of acquisition related intangibles assets.
71
The preliminary fair value of identified intangible assets and their respective useful lives are as follows:
|
|
|
Fair Value |
|
|
Weighted- Average Amortization Periods (Yrs) |
|
||
|
Brands |
|
$ |
25,740 |
|
|
|
18 |
|
|
Technology |
|
|
13,483 |
|
|
|
13 |
|
|
Customer relationships |
|
|
202,245 |
|
|
|
26 |
|
|
Sales order backlog |
|
|
7,355 |
|
|
|
0.4 |
|
|
Identified intangible assets |
|
$ |
248,823 |
|
|
|
24 |
|
|
|
|
|
|
|
|
|
|
|
Acquisition of Custom Fluidpower
On August 1, 2018, the Company acquired all of the outstanding equity interests of Custom Fluidpower Pty Ltd, an Australian proprietary limited liability company. The acquisition was completed pursuant to a Share Sale Agreement among the Company and the shareholders of Custom Fluidpower. The fair value of consideration paid at closing totaled $26,655 and included 333,065 shares of the Company’s common stock and cash of $9,315; cash paid net of cash acquired totaled $7,518. The cash consideration was funded with borrowings on the Company’s credit facility.
Custom Fluidpower was acquired to further diversify the Company’s hydraulics product and service portfolio and broaden the Company’s global footprint. The results of Custom Fluidpower’s operations are reported in the Company’s Hydraulics segment and have been included in the consolidated financial statements since the date of acquisition. Supplemental pro forma information has not been provided as the acquisition did not have a material impact on the Company’s consolidated results of operations.
Transaction costs of $1,179 incurred in connection with the acquisition are included in selling, engineering and administrative expenses in the Consolidated Statement of Operations for the year ended December 29, 2018.
The Company recorded $5,111 in goodwill and $7,556 in other identifiable intangible assets in connection with the acquisition; however, the purchase price allocation is preliminary, pending final intangibles valuation and tax related adjustments, and may be revised during the remainder of the measurement period (which will not exceed 12 months from the acquisition date). Any such revisions or changes to the fair values of the tangible and intangible assets acquired and liabilities assumed may be material.
Acquisition of Enovation Controls
On December 5, 2016, the Company completed the acquisition of Enovation Controls, LLC, a global provider of electronic control, display and instrumentation solutions. Historically Enovation Controls sold products to four customer markets: natural gas production controls (NGPC), engine controls and fuel systems (ECFS), power controls (PC) and vehicle technologies (VT). Prior to the closing date, and pursuant to an Asset Transfer Agreement, Enovation Controls transferred the assets and liabilities of their lines of business associated with the NGPC and ECFS customer markets to a separate legal entity, leaving Enovation Controls with only the lines of business associated with the PC and VT customer markets and the related agreed upon assets and liabilities to be acquired by Helios.
The acquisition of Enovation Controls enables the Company to expand the current complete system solution portfolio and develop product and end market diversification. The results of Enovation Controls’ operations have been included in the consolidated financial statements since the acquisition date.
72
Pursuant to a Unit Purchase Agreement, Helios acquired all of the outstanding membership units of Enovation Controls for initial cash consideration of $201,020 and additional cash earn-out potential of $50,000. Total consideration for the acquisition was subject to a post-closing adjustment for working capital in accordance with the terms of the Purchase Agreement. The consideration paid for the acquisition was funded with cash on hand and proceeds from the Company’s existing revolving line of credit.
The contingent consideration arrangement requires the Company to pay up to $50,000 of additional consideration to Enovation Controls’s former owners based on defined revenue and EBITDA targets. The potential payments are due in three installments, to be paid immediately following the 9, 18 and 27 month periods after closing, of which the first two payments were made in October 2017 and July 2018. See Note 4 for a summary of the changes in estimated fair value of the contingent consideration liability.
The fair value of total purchase consideration consisted of the following:
|
Cash |
|
$ |
201,020 |
|
|
Acquisition date fair value of contingent consideration |
|
|
41,391 |
|
|
Post-closing adjustment for working capital |
|
|
500 |
|
|
Total purchase consideration |
|
|
242,911 |
|
|
Less: cash acquired |
|
|
(964 |
) |
|
Total purchase consideration, net of cash acquired |
|
$ |
241,947 |
|
The purchase price was allocated to tangible and intangible assets acquired and liabilities assumed based on their estimated fair values. The allocation of the total purchase price, net of cash acquired, is as follows:
|
Accounts receivable |
|
$ |
9,502 |
|
|
Inventories |
|
|
16,979 |
|
|
Other current assets |
|
|
176 |
|
|
Property, plant and equipment |
|
|
10,546 |
|
|
Goodwill |
|
|
103,671 |
|
|
Intangible assets |
|
|
108,070 |
|
|
Other assets |
|
|
8 |
|
|
Total assets acquired |
|
|
248,952 |
|
|
Accounts payable |
|
|
(3,260 |
) |
|
Accrued expenses and other liabilities |
|
|
(3,745 |
) |
|
Total liabilities assumed |
|
|
(7,005 |
) |
|
Fair value of net assets acquired |
|
$ |
241,947 |
|
Goodwill is primarily attributable to the assembled workforce, new product development capabilities and anticipated synergies and economies of scale expected from the operations of the combined company. The synergies include certain cost savings, operating efficiencies, and other strategic benefits projected to be achieved as a result of the acquisition. All goodwill is expected to be deductible for tax purposes.
Transaction costs of $1,537 incurred in connection with the acquisition are included in selling, engineering and administrative expenses in the Consolidated Statement of Operations for the year ended December 31, 2016.
The net sales and loss before income taxes of Enovation Controls, included in the Consolidated Statement of Operations for the period from December 5, 2016 through December 31, 2016 totaled approximately $4,136 and $2,151, respectively. Included in Enovation Controls’ loss for the period are $2,006 of charges related to the purchase accounting effects of inventory step-up to fair value and amortization of acquisition-related intangible assets.
73
The fair value of identified intangible assets and their respective useful lives are as follows:
|
|
|
Fair Value |
|
|
Weighted- Average Amortization Periods (Yrs) |
|
||
|
Brands |
|
$ |
30,000 |
|
|
|
20 |
|
|
Non-compete agreements |
|
|
950 |
|
|
|
5 |
|
|
Technology |
|
|
17,500 |
|
|
|
9 |
|
|
Supply agreement |
|
|
21,000 |
|
|
|
10 |
|
|
Sales order backlog |
|
|
620 |
|
|
|
1 |
|
|
Customer relationships |
|
|
38,000 |
|
|
|
20 |
|
|
Identified intangible assets |
|
$ |
108,070 |
|
|
|
16 |
|
Unaudited Pro Forma Information
The following unaudited pro forma financial information presents combined results of operations for each of the periods presented, as if Enovation Controls had been acquired as of the beginning of 2015 and Faster had been acquired as of the beginning of 2017. The financial results of Enovation Controls included in the pro forma information provided below reflect net sales and direct costs and operating expenses related to the acquired lines of business only.
The PC and VT lines of business are not separate legal entities and were never operated as stand-alone businesses, divisions or subsidiaries and Enovation Controls has never maintained the distinct and separate accounts necessary to prepare full carve out financial statements. Due to the impracticability of obtaining full financial information for the carve-out operations, certain costs of Enovation Controls, primarily related to corporate overhead, foreign currency translation gains and losses and interest expense are not included in the pro forma results prior to the acquisition date.
The pro forma information includes adjustments to amortization and depreciation for intangible assets and property, plant and equipment, net sales and cost of sales for the effects of the Enovation Controls supply agreement and interest expense from borrowings to fund the acquisitions. Non-recurring pro forma adjustments directly attributable to the Enovation Controls acquisition included in the pro forma information presented below include the purchase accounting effect of inventory step up to fair value of $1,021 and transaction costs totaling $1,537. Non-recurring pro forma adjustments directly attributable to the Faster acquisition included in the pro forma information presented below include the purchase accounting effect of inventory step up to fair value of $4,115, transaction costs totaling $4,271, amortization of sales order backlog intangible asset totaling $7,032, accelerated amortization of Faster pre-acquisition loan costs of $2,328 and loss on forward contract entered into in connection with the acquisition totaling $2,535.
The pro forma information does not reflect any operating efficiencies or potential cost savings that may result from the acquisitions. Accordingly, the pro forma information is for illustrative purposes only and is not intended to present or be indicative of the actual results of operations of the combined company that may have been achieved had the acquisitions actually occurred at the beginning of 2015 and 2017, nor is it intended to represent or be indicative of future results of operations of the combined business. Consequently, actual results will differ from the unaudited pro forma information presented below:
|
|
|
2018 |
|
|
2017 |
|
|
2016 |
|
|||
|
Net sales |
|
$ |
548,986 |
|
|
$ |
463,468 |
|
|
$ |
277,706 |
|
|
Operating income |
|
|
98,640 |
|
|
|
79,476 |
|
|
|
47,673 |
|
|
Net income |
|
|
61,661 |
|
|
|
37,723 |
|
|
|
31,064 |
|
|
Basic and diluted net income per common share |
|
|
1.97 |
|
|
|
1.20 |
|
|
|
1.16 |
|
74
4. FAIR VALUE OF FINANCIAL INSTRUMENTS
The following tables provide information regarding the Company’s assets and liabilities measured at fair value on a recurring basis at December 29, 2018, and December 30, 2017.
|
|
|
December 29, 2018 |
|
|||||||||||||
|
|
|
|
|
|
|
|
|
|
|
Significant Other |
|
|
Significant |
|
||
|
|
|
|
|
|
|
Quoted Market |
|
|
Observable |
|
|
Unobservable |
|
|||
|
|
|
Total |
|
|
Prices (Level 1) |
|
|
Inputs (Level 2) |
|
|
Inputs (Level 3) |
|
||||
|
Liabilities |
|
|
|
|
|
|
|
|
|
|
|
|
|
|
|
|
|
Interest rate swap contract |
|
$ |
2,309 |
|
|
$ |
— |
|
|
$ |
2,309 |
|
|
$ |
— |
|
|
Forward foreign exchange contracts |
|
|
137 |
|
|
|
— |
|
|
|
137 |
|
|
|
— |
|
|
Contingent consideration |
|
|
18,960 |
|
|
|
— |
|
|
|
— |
|
|
|
18,960 |
|
|
Total |
|
$ |
21,406 |
|
|
$ |
— |
|
|
$ |
2,446 |
|
|
$ |
18,960 |
|
|
|
|
December 30, 2017 |
|
|||||||||||||
|
|
|
|
|
|
|
|
|
|
|
Significant Other |
|
|
Significant |
|
||
|
|
|
|
|
|
|
Quoted Market |
|
|
Observable |
|
|
Unobservable |
|
|||
|
|
|
Total |
|
|
Prices (Level 1) |
|
|
Inputs (Level 2) |
|
|
Inputs (Level 3) |
|
||||
|
Liabilities |
|
|
|
|
|
|
|
|
|
|
|
|
|
|
|
|
|
Contingent consideration |
|
$ |
33,882 |
|
|
$ |
— |
|
|
$ |
— |
|
|
$ |
33,882 |
|
|
Total |
|
$ |
33,882 |
|
|
$ |
— |
|
|
$ |
— |
|
|
$ |
33,882 |
|
A summary of changes in the estimated fair value of contingent consideration at December 29, 2018 and December 30, 2017 is as follows:
|
Balance at December 31, 2016 |
|
$ |
35,077 |
|
|
Measurement period adjustment |
|
|
6,314 |
|
|
Change in estimated fair value |
|
|
8,299 |
|
|
Accretion in value |
|
|
1,177 |
|
|
Payment on liability |
|
|
(16,985 |
) |
|
Balance at December 30, 2017 |
|
$ |
33,882 |
|
|
Contingent consideration incurred in connection with Faster acquisition |
|
|
938 |
|
|
Change in estimated fair value |
|
|
391 |
|
|
Accretion in value |
|
|
1,091 |
|
|
Payment on liability |
|
|
(17,342 |
) |
|
Balance at December 29, 2018 |
|
$ |
18,960 |
|
During 2017, management completed the valuation of the acquisition date fair value of contingent consideration incurred in connection with the Enovation Controls acquisition resulting in a measurement period adjustment which increased the fair value of the liability by $6,314. During the years ended December 29, 2018 and December 30, 2017, adjustments to the fair value of contingent consideration were recorded based on Enovation Controls’ results of operation during the period and managements’ revision of revenue and EBITDA forecasts. The adjustments were not considered measurement period adjustments and were therefore recognized in earnings for the period.
As part of the Faster acquisition, a contingent liability was recorded pursuant to the Share Purchase Agreement that allows for future payments to the sellers for certain tax benefits realized within two years of the acquisition date.
75
|
|
|
December 29, 2018 |
|
|
December 30, 2017 |
|
||
|
Raw materials |
|
$ |
39,086 |
|
|
$ |
26,426 |
|
|
Work in process |
|
|
26,871 |
|
|
|
6,910 |
|
|
Finished goods |
|
|
23,963 |
|
|
|
9,920 |
|
|
Provision for obsolete and slow moving inventory |
|
|
(3,931 |
) |
|
|
(1,711 |
) |
|
Total |
|
$ |
85,989 |
|
|
$ |
41,545 |
|
6. PROPERTY, PLANT, AND EQUIPMENT
|
|
|
December 29, 2018 |
|
|
December 30, 2017 |
|
||
|
Machinery and equipment |
|
$ |
134,244 |
|
|
$ |
103,024 |
|
|
Office furniture and equipment |
|
|
17,902 |
|
|
|
15,160 |
|
|
Buildings |
|
|
54,592 |
|
|
|
48,977 |
|
|
Building and land improvements |
|
|
9,781 |
|
|
|
9,513 |
|
|
Land |
|
|
17,717 |
|
|
|
16,977 |
|
|
|
|
$ |
234,236 |
|
|
$ |
193,651 |
|
|
Less: Accumulated depreciation |
|
|
(120,571 |
) |
|
|
(107,251 |
) |
|
Construction in progress |
|
|
13,203 |
|
|
|
5,531 |
|
|
Total |
|
$ |
126,868 |
|
|
$ |
91,931 |
|
Depreciation expense for the years ended December 29, 2018, December 30, 2017, and December 31, 2016 totaled $16,452, $10,767, and $9,184, respectively.
7. GOODWILL AND INTANGIBLE ASSETS
Goodwill
A summary of changes in goodwill by segment for the years ended December 29, 2018 and December 30, 2017 is as follows:
|
|
|
Hydraulics |
|
|
Electronics |
|
|
Total |
|
|||
|
Balance as December 31, 2016 |
|
$ |
2,214 |
|
|
$ |
101,369 |
|
|
$ |
103,583 |
|
|
Working capital adjustment, Enovation Controls acquisition |
|
|
— |
|
|
|
500 |
|
|
|
500 |
|
|
Measurement period adjustment, Enovation Controls acquisition |
|
|
— |
|
|
|
4,504 |
|
|
|
4,504 |
|
|
Currency translation |
|
|
282 |
|
|
|
— |
|
|
|
282 |
|
|
Balance as December 30, 2017 |
|
$ |
2,496 |
|
|
$ |
106,373 |
|
|
$ |
108,869 |
|
|
Acquisition of Faster |
|
|
288,792 |
|
|
|
— |
|
|
|
288,792 |
|
|
Acquisition of Custom Fluidpower |
|
|
5,111 |
|
|
|
— |
|
|
|
5,111 |
|
|
Currency translation |
|
|
(19,641 |
) |
|
|
— |
|
|
|
(19,641 |
) |
|
Balance as December 29, 2018 |
|
$ |
276,758 |
|
|
$ |
106,373 |
|
|
$ |
383,131 |
|
76
Intangibles
At December 29, 2018, and December 30, 2017, intangible assets consisted of the following:
|
|
|
|
|
December 29, 2018 |
|
|
December 30, 2017 |
|
||||||||||||||||||
|
|
|
Useful life (years) |
|
Gross carrying amount |
|
|
Accumulated amortization |
|
|
Net carrying amount |
|
|
Gross carrying amount |
|
|
Accumulated amortization |
|
|
Net carrying amount |
|
||||||
|
Definite-lived intangibles: |
|
|
|
|
|
|
|
|
|
|
|
|
|
|
|
|
|
|
|
|
|
|
|
|
|
|
|
Trade names and brands |
|
10-20 |
|
$ |
56,604 |
|
|
$ |
(4,712 |
) |
|
$ |
51,892 |
|
|
$ |
30,774 |
|
|
$ |
(2,115 |
) |
|
$ |
28,659 |
|
|
Non-compete agreements |
|
5 |
|
|
950 |
|
|
|
(396 |
) |
|
|
554 |
|
|
|
950 |
|
|
|
(206 |
) |
|
|
744 |
|
|
Technology |
|
7 - 13 |
|
|
32,004 |
|
|
|
(5,488 |
) |
|
|
26,516 |
|
|
|
18,435 |
|
|
|
(2,671 |
) |
|
|
15,764 |
|
|
Supply agreement |
|
10 |
|
|
21,000 |
|
|
|
(4,375 |
) |
|
|
16,625 |
|
|
|
21,000 |
|
|
|
(2,275 |
) |
|
|
18,725 |
|
|
Sales order backlog |
|
1 |
|
|
7,355 |
|
|
|
(7,355 |
) |
|
|
— |
|
|
|
620 |
|
|
|
(620 |
) |
|
|
— |
|
|
Customer relationships |
|
15 - 26 |
|
|
232,275 |
|
|
|
(10,168 |
) |
|
|
222,107 |
|
|
|
39,751 |
|
|
|
(2,607 |
) |
|
|
37,144 |
|
|
Licensing agreement |
|
15 |
|
|
3,716 |
|
|
|
(862 |
) |
|
|
2,854 |
|
|
|
3,716 |
|
|
|
(621 |
) |
|
|
3,095 |
|
|
|
|
|
|
$ |
353,904 |
|
|
$ |
(33,356 |
) |
|
$ |
320,548 |
|
|
$ |
115,246 |
|
|
$ |
(11,115 |
) |
|
$ |
104,131 |
|
Total amortization expense for the years ended 2018, 2017 and 2016 was approximately $23,262, $8,423 and $1,545, respectively. Total estimated amortization expense for the years 2019 through 2023 is presented below.
|
Year: |
|
|
|
|
|
2019 |
|
$ |
18,377 |
|
|
2020 |
|
|
18,344 |
|
|
2021 |
|
|
18,243 |
|
|
2022 |
|
|
17,980 |
|
|
2023 |
|
|
17,921 |
|
|
Total |
|
$ |
90,865 |
|
8. DERIVATIVE FINANCIAL INSTRUMENTS
The Company addresses certain financial exposures through a controlled program of risk management that includes the use of derivative financial instruments. The Company enters into foreign currency forward contracts to reduce the effects of fluctuating foreign currency exchange rates. In addition, the Company enters into interest rate derivatives to manage the effects of interest rate movements on the Company’s credit facilities.
For each derivative contract entered into where the Company looks to obtain hedge accounting treatment, the Company formally and contemporaneously documents all relationships between hedging instruments and hedged items, as well as its risk-management objective and strategy for undertaking the hedge transaction, the nature of the risk being hedged, how the hedging instruments’ effectiveness in offsetting the hedged risk will be assessed prospectively and retrospectively. This process includes linking all derivatives to specific assets and liabilities on the balance sheet or to specific firm commitments or forecasted transactions. The Company also formally assesses, both at the inception of the hedges and on an ongoing basis, whether the derivatives that are used in hedging transactions are highly effective in offsetting changes in fair values or cash flows of hedged items. If it is determined that a derivative is not highly effective, or that it has ceased to be a highly effective hedge, the Company will discontinue hedge accounting with respect to that derivative prospectively.
77
The fair value of the Company’s derivative financial instruments included in the Consolidated Balance Sheets is presented as follows:
|
|
Asset Derivatives |
|
|
Liability Derivatives |
|
||||||
|
|
Balance Sheet |
|
Fair Value (1) |
|
|
Balance Sheet |
|
Fair Value (1) |
|
||
|
|
Location |
|
December 29, 2018 |
|
|
Location |
|
December 29, 2018 |
|
||
|
Derivatives designated as hedging instruments: |
|
|
|
|
|
|
|
|
|
|
|
|
Interest rate swap contract |
Other assets |
|
$ |
— |
|
|
Other non-current liabilities |
|
$ |
2,309 |
|
|
Derivatives not designated as hedging instruments: |
|
|
|
|
|
|
|
|
|
|
|
|
Forward foreign exchange contract |
Other current assets |
|
|
— |
|
|
Other current liabilities |
|
|
137 |
|
|
Total derivatives |
|
|
$ |
— |
|
|
|
|
$ |
2,446 |
|
|
(1) See Note 4 for further information about how the fair value of derivative assets and liabilities are determined |
|
||||||||||
The amount of the gains and losses related to the Company’s derivative financial instruments are presented as follows:
|
|
|
Amount of Gain or (Loss) Recognized in OCI on Derivative (Effective Portion) |
|
|
Location of Gain or (Loss) Reclassified from AOCI |
|
Amount of Gain or (Loss) Reclassified from AOCI into Earnings (Effective Portion) |
|
||
|
|
|
December 29, 2018 |
|
|
into Earnings (Effective Portion) |
|
December 29, 2018 |
|
||
|
Derivatives in cash flow hedging relationships: |
|
|
|
|
|
|
|
|
|
|
|
Interest rate swap contract |
|
$ |
(2,309 |
) |
|
Interest expense, net |
|
$ |
(547 |
) |
Interest expense presented in the Consolidated Statements of Operations, in which the effects of cash flow hedges are recorded, totaled $13,876 for the year ended December 29, 2018.
|
|
|
Amount of Gain or (Loss) Recognized in Earnings on Derivatives |
|
|
Location of Gain or (Loss) Recognized |
|
|
|
|
December 29, 2018 |
|
|
in Earnings on Derivatives |
|
|
Derivatives not designated as hedging instruments: |
|
|
|
|
|
|
|
Forward foreign exchange contracts |
|
$ |
(3,496 |
) |
|
Foreign currency transaction gain loss, net |
Interest Rate Swap Contract
Helios primarily utilizes variable-rate debt which exposes the Company to variability in interest payments. The Company enters into various types of derivative instruments to manage fluctuations in cash flows resulting from interest rate risk attributable to changes in the benchmark interest rates.
The Company assesses interest rate cash flow risk by continually identifying and monitoring changes in interest rate exposures that may adversely impact expected future cash flows and by evaluating hedging opportunities.
The Company maintains risk management control systems to monitor interest rate cash flow risk attributable to both the Company’s outstanding and forecasted debt obligations as well as the Company’s offsetting hedge positions. The risk management control systems involve the use of analytical techniques to estimate the expected impact of changes in interest rates on the Company’s future cash flows.
78
During the third quarter of fiscal year 2018, the Company entered into an interest rate swap transaction to hedge the variable interest rate payments on the credit facilities. In connection with this transaction, the Company pays interest based upon a fixed rate as agreed upon with the respective counterparties and receives variable rate interest payments based on the one-month LIBOR. The interest rate swap has an aggregate notional amount of $200,000, which decreases by $25,000 annually starting in September 2019, and has been designated as a hedging instrument and accounted for as a cash flow hedge. The interest rate swap was effective on August 2, 2018 and is scheduled to expire on April 3, 2023. The contract will be settled with the respective counterparties on a net basis at each settlement date.
Forward Foreign Exchange Contracts
The Company enters into forward contracts to economically hedge transactional exposure associated with commitments arising from transactions denominated in a currency other than the functional currency of the respective operating entity. The Company’s forward contracts are not designated as hedging instruments for accounting purposes.
During the year ended December 29, 2018, the Company entered into a forward foreign exchange currency contract, for the purchase of €370,000, to economically hedge transactional exposure associated with the acquisition of Faster, which was denominated in euros. The contract settled upon closing of the acquisition of Faster.
At December 29, 2018, the Company had forward foreign exchange contracts to buy euros with a notional amount of $2,500. These contracts are at various exchange rates and expire in February 2019.
Total long-term non-revolving debt consists of the following:
|
|
Maturity Date |
|
December 29, 2018 |
|
|
|
Long-term non-revolving debt: |
|
|
|
|
|
|
Term loan credit facility with PNC Bank |
4/3/2023 |
|
$ |
96,250 |
|
|
Term loan credit facility with Shinhan Bank |
3/30/2020 |
|
|
895 |
|
|
Other long-term debt |
Various |
|
|
838 |
|
|
Total long-term non-revolving debt |
|
|
|
97,983 |
|
|
Less: current portion of long-term non-revolving debt |
|
|
|
5,215 |
|
|
Less: unamortized debt issuance costs |
|
|
|
1,048 |
|
|
Total long-term non-revolving debt, net |
|
|
$ |
91,720 |
|
Information on the Company's revolving credit facilities is as follows:
|
|
|
|
Balance |
|
|
Available credit |
|
||||||||||
|
|
Maturity Date |
|
December 29, 2018 |
|
|
December 30, 2017 |
|
|
December 29, 2018 |
|
|
December 30, 2017 |
|
||||
|
Revolving credit facilities: |
|
|
|
|
|
|
|
|
|
|
|
|
|
|
|
|
|
|
Revolving line of credit with PNC |
4/3/2023 |
|
$ |
255,750 |
|
|
$ |
116,000 |
|
|
$ |
144,250 |
|
|
$ |
184,000 |
|
|
Revolving line of credit with NAB |
1/31/2019 |
|
|
— |
|
|
|
— |
|
|
|
2,155 |
|
|
|
— |
|
|
Total revolving credit facilities |
|
|
$ |
255,750 |
|
|
$ |
116,000 |
|
|
$ |
146,405 |
|
|
$ |
184,000 |
|
79
Future maturities of total debt are as follows:
|
Year: |
|
|
|
|
2019 |
$ |
5,460 |
|
|
2020 |
|
7,281 |
|
|
2021 |
|
7,655 |
|
|
2022 |
|
8,833 |
|
|
2023 |
|
324,504 |
|
|
|
$ |
353,733 |
|
On April 1, 2018, the Company entered into an amendment to its credit agreement with PNC Bank, National Association, as administrative agent, and the lenders party thereto. The amendment increased the revolving credit facility up to an aggregate maximum principal amount of $400,000, up from $300,000 under the original agreement, added a new term loan credit facility in an aggregate principal amount of $100,000, and increased the accordion feature to permit the increase of the Amended and Restated Facility by up to an additional $200,000. Borrowings under the line of credit bear interest at defined rates plus an applicable margin based on the Company’s leverage ratio. The agreement requires quarterly term loan payments of $1,250. The required payments increase to $1,875 in July 2020, and $2,500 in July 2022, with the balance due on the maturity date.
The amendment was entered into contemporaneously with the transfer of substantially all of the Company’s historical net operating assets of the Sun Hydraulics brand entities to the Company’s wholly-owned subsidiary, Sun Hydraulics, LLC, a newly-formed Florida limited liability company, and in preparation for the acquisition of Faster. Sun Hydraulics, LLC was added as an additional guarantor of the amended facility. In addition, Sun Hydraulics, LLC joined the existing Security Agreement between the Company, Enovation Controls and PNC Bank, for the benefit of the lenders, granting a security interest in substantially all of their respective assets.
The credit agreement requires the Company to comply with a number of restrictive covenants. These covenants limit, in certain circumstances, the Company’s ability to take a variety of actions, including but not limited to: incur indebtedness; create or maintain liens on its property or assets; make investments, loans and advances; repurchase shares of its common stock; engage in acquisitions, mergers, joint ventures, consolidation and asset sales; and pay dividends and distributions.
The line of credit is guaranteed by the Company’s U.S. domestic subsidiaries and requires any future U.S. domestic subsidiaries to join as guarantors. In addition, the line of credit is required to be secured by substantially all of the assets of the Company and its current and future U.S. domestic subsidiaries of the Company. Accordingly, (i) the Company entered into a security agreement granting a security interest in substantially all of its respective assets; (ii) the Company entered into a pledge agreement granting a security interest in certain equity ownership in certain of its subsidiaries, and (iii) the Company and/or certain of its subsidiaries entered into certain other additional agreements further granting security interests in certain specific assets, including intellectual property rights, in each case to secure amounts borrowed under the credit agreement.
The Faster acquisition was completed on April 5, 2018, at which time the Company borrowed $258,000 on the revolving credit facility and executed the term loan. The interest rate in effect on this credit agreement at December 29, 2018 was 4.51%. Interest expense recognized on this credit agreement during the year ended December 29, 2018, December 30, 2017 and December 31, 2016 was $12,799, $4,082 and $483, respectively. As of December 29, 2018, the Company was in compliance with all debt covenants related to the credit agreement.
80
On March 30, 2018, the Company entered into a credit agreement with Shinhan Bank that provides a term loan of 1,000,000 Korean won. The proceeds from the term loan were used to fund the construction of the new production facility in South Korea. The loan matures in March 2020, at which time the full amount will become due. Interest is charged at a one-year variable rate, 2.05% as of December 29, 2018.
The Company has a revolving line of credit with National Australia Bank which is primarily used to meet short-term working capital requirements. The agreement allows for maximum borrowings of 3,000 Australian dollars. Interest is payable monthly at the daily interest rate plus a fixed margin of 1.6%, 5.6% as of December 29, 2018. Principal and interest are due on the maturity date. The loan is secured by assets of Custom Fluidpower.
The Company’s other long-term debt primarily consists of auto loans payable to National Australia Bank. Principal and interest payments are due monthly. The loans mature at various dates through June 2023. Interest is charged at various rates ranging from 3.9% to 5.1%.
10. PUBLIC STOCK OFFERING
On February 6, 2018, the Company completed a public offering of its common stock, pursuant to which the Company sold 4,400,000 shares at a public offering price of $57.50 per share. The Company received net proceeds from the sale totaling $239,793, after deducting the underwriting discount and other offering expenses. The Company used the net proceeds for the repayment of debt under its credit facility and to partially fund the acquisition of Faster, which closed on April 5, 2018.
The Company declared dividends of $11,444, $10,273, and $10,757 to shareholders in 2018, 2017, and 2016, respectively.
The Company declared the following regular quarterly dividends to shareholders during 2018, 2017 and 2016. The dividends were primarily declared to shareholders of record on the 5th day following the respective quarter end and paid on the 20th day of each month following the date of declaration.
|
|
|
|
2018 |
|
|
|
2017 |
|
|
|
2016 |
|
|
First quarter |
|
$ |
0.09 |
|
|
$ |
0.09 |
|
|
$ |
0.09 |
|
|
Second quarter |
|
|
0.09 |
|
|
|
0.09 |
|
|
|
0.09 |
|
|
Third quarter |
|
|
0.09 |
|
|
|
0.09 |
|
|
|
0.09 |
|
|
Fourth quarter |
|
|
0.09 |
|
|
|
0.09 |
|
|
|
0.09 |
|
In addition to the regular quarterly dividends, the Company declared special cash dividends in 2017 and 2016 equal to $0.02 and $0.04, respectively. The 2017 dividend was paid on March 31, 2017, to shareholders of record on March 15, 2017, and the 2016 dividend was paid on March 31, 2016, to shareholders of record on March 15, 2016.
12. INCOME TAXES
Deferred income tax assets and liabilities are provided to reflect the future tax consequences of differences between the tax basis of assets and liabilities and their reported amounts in the financial statements.
81
For financial reporting purposes, income before income taxes includes the following components:
|
|
|
For the year ended |
|
|||||||||
|
|
|
December 29, 2018 |
|
|
December 30, 2017 |
|
|
December 31, 2016 |
|
|||
|
United States |
|
$ |
44,693 |
|
|
$ |
37,005 |
|
|
$ |
30,562 |
|
|
Foreign |
|
|
11,702 |
|
|
|
10,539 |
|
|
|
4,339 |
|
|
Total |
|
$ |
56,395 |
|
|
$ |
47,544 |
|
|
$ |
34,901 |
|
The Company derives its pretax income based on the consolidated results of its legal entities. Products manufactured in the U.S. are sold worldwide and are the primary reason that pretax income in the U.S. is higher than foreign pretax income. The U.S. legal entities had third party export sales of $98,876, $85,479, and $62,661 for the 2018, 2017 and 2016 years, respectively. Foreign pretax income is impacted by the level of foreign manufacturing, sales at varying market levels, as well as direct sales to large OEM customers.
The components of the income tax provision (benefit) are as follows:
|
|
|
For the year ended |
|
|||||||||
|
|
|
December 29, 2018 |
|
|
December 30, 2017 |
|
|
December 31, 2016 |
|
|||
|
Current tax expense (benefit): |
|
|
|
|
|
|
|
|
|
|
|
|
|
United States |
|
$ |
4,229 |
|
|
$ |
17,165 |
|
|
$ |
9,740 |
|
|
State and local |
|
|
2,522 |
|
|
|
3,095 |
|
|
|
923 |
|
|
Foreign |
|
|
3,707 |
|
|
|
2,496 |
|
|
|
1,377 |
|
|
Total current |
|
|
10,458 |
|
|
|
22,756 |
|
|
|
12,040 |
|
|
Deferred tax expense (benefit): |
|
|
|
|
|
|
|
|
|
|
|
|
|
United States |
|
|
380 |
|
|
|
(4,922 |
) |
|
|
(341 |
) |
|
State and local |
|
|
110 |
|
|
|
(986 |
) |
|
|
387 |
|
|
Foreign |
|
|
(1,283 |
) |
|
|
(862 |
) |
|
|
(489 |
) |
|
Total deferred |
|
|
(793 |
) |
|
|
(6,770 |
) |
|
|
(443 |
) |
|
Total income tax provision |
|
$ |
9,665 |
|
|
$ |
15,986 |
|
|
$ |
11,597 |
|
On December 22, 2017, the Tax Cuts and Jobs Act of 2017 (the “Act”) was signed into law making significant changes to the Internal Revenue Code. Changes include, but are not limited to, a corporate tax rate decrease from 35% to 21% effective for tax years beginning after December 31, 2017, the transition of U.S international taxation from a worldwide tax system to a territorial system, and a one-time transition tax on the mandatory deemed repatriation of cumulative foreign earnings as of December 31, 2017. As a result of the Act, the Company recorded in the 2017 year-end income tax provision $459 of additional income tax expense, including a benefit of $1,541 related to remeasurement of deferred tax assets and liabilities and $2,000 of expense related to one-time transition tax on mandatory deemed repatriation of foreign earnings. Refinements to these items were made during 2018 for the purpose of 2017 tax return reporting, and provision-to-return adjustments have been recorded in the 2018 year-end provision to adjust the transition tax to $630. The Company elected to pay the transition tax over an eight year period, as permitted by the legislation.
82
On December 22, 2017, Staff Accounting Bulletin No. 118 ("SAB 118") was issued to address the application of US GAAP in situations when a registrant does not have the necessary information available, prepared, or analyzed in reasonable detail to complete the accounting for certain income tax effects of the Act. In accordance with SAB 118, the Company determined the $1,541 of deferred tax benefit recorded related to remeasurement of deferred tax assets and liabilities and $2,000 of current tax expense recorded related to transition tax on mandatory deemed repatriation of foreign earnings were provisional amounts and reasonable estimates at December 30, 2017. For 2018 year-end provision purposes, additional work was performed to complete a more detailed analysis of deferred tax assets and liabilities, historical attributes giving rise to the transition tax calculation inputs, and potential correlative adjustments of each of these items. Adjustments to these amounts were recorded to current tax expense in 2018.
Further, in accordance with SAB 118, the Company continued evaluating the permanent reinvestment assertion as further consideration is given to how the Act impacts the future cash flow position of the Company. Helios’s foreign subsidiaries generate earnings that are not subject to U.S. income taxes so long as they are permanently reinvested in the Company’s operations outside of the U.S. Pursuant to ASC Topic No. 740-30 (formerly APB 23), undistributed earnings of foreign subsidiaries that are no longer permanently reinvested would become subject to deferred income taxes under U.S. tax law. In determining if the undistributed earnings of Helios’s foreign subsidiaries are permanently reinvested, management considers the following: (i) the forecasts, budgets, debt commitments, and cash requirements of the U.S business and the foreign subsidiaries, both for the short and long term; (ii) the tax consequences of any decision to reinvest foreign earnings, including any changes in U.S. income tax law relating to the treatment of these undistributed foreign earnings; and (iii) any U.S. and foreign government programs or regulations relating to the repatriation of these unremitted earnings. As of December 29, 2018, the Company recognized deferred income taxes of approximately $31 on earnings that are no longer permanently reinvested in foreign operations. Management asserts that approximately $19,700 of undistributed earnings are permanently reinvested in the Company’s foreign operations and have no current plans to repatriate those earnings.
In January 2018, the FASB released guidance on the accounting for tax on the global intangible low-taxed income (“GILTI”) provisions of the Act. The GILTI provisions impose a tax on foreign income in excess of a deemed return on tangible assets of foreign corporations. The guidance indicates that either accounting for deferred taxes related to GILTI inclusions or treating any taxes on GILTI inclusions as a period cost are acceptable methods subject to an accounting policy election. The Company has elected to treat any taxes on GILTI inclusions as period costs.
The Company also recorded estimates in the 2017 year-end provision in accordance with SAB 118 for certain directly- and indirectly-correlated effects in the year end income tax provision including, but not limited to, state and local income taxes, domestic production activities deduction, and fixed asset depreciation. These effects have been further evaluated and final determinations recorded of the appropriate accounting for the Act.
83
The reconciliation between the effective income tax rate and the U.S. federal statutory rate is as follows:
|
|
|
For the year ended |
|
|||||||||
|
|
|
December 29, 2018 |
|
|
December 30, 2017 |
|
|
December 31, 2016 |
|
|||
|
U.S. federal taxes at statutory rate |
|
$ |
11,843 |
|
|
$ |
16,640 |
|
|
$ |
12,245 |
|
|
Increase (decrease) |
|
|
|
|
|
|
|
|
|
|
|
|
|
Foreign tax credit |
|
|
— |
|
|
|
— |
|
|
|
— |
|
|
Domestic production activity deduction |
|
|
— |
|
|
|
(1,909 |
) |
|
|
(1,032 |
) |
|
Foreign income taxed at different rate |
|
|
1,292 |
|
|
|
(1,177 |
) |
|
|
(381 |
) |
|
FDII deduction |
|
|
(2,195 |
) |
|
|
— |
|
|
|
— |
|
|
Change in estimates related to prior years |
|
|
(2,049 |
) |
|
|
— |
|
|
|
— |
|
|
US income tax reform |
|
|
— |
|
|
|
459 |
|
|
|
— |
|
|
State and local taxes, net |
|
|
1,462 |
|
|
|
1,208 |
|
|
|
586 |
|
|
Current year tax credits |
|
|
(633 |
) |
|
|
— |
|
|
|
— |
|
|
Foreign deferred other true up |
|
|
(810 |
) |
|
|
— |
|
|
|
— |
|
|
Change in reserve |
|
|
578 |
|
|
|
829 |
|
|
|
(284 |
) |
|
Foreign patent box benefit |
|
|
(937 |
) |
|
|
— |
|
|
|
— |
|
|
Global intangible low-taxed income |
|
|
526 |
|
|
|
— |
|
|
|
— |
|
|
Other |
|
|
588 |
|
|
|
(64 |
) |
|
|
463 |
|
|
Income tax provision |
|
$ |
9,665 |
|
|
$ |
15,986 |
|
|
$ |
11,597 |
|
Deferred income taxes reflect the net tax effects of temporary differences between the carrying amounts of assets and liabilities for financial reporting purposes and the amounts used for income taxes. The temporary differences that give rise to significant portions of the deferred tax assets and liabilities as of December 29, 2018, and December 30, 2017, are presented below:
|
|
|
December 29, 2018 |
|
|
December 30, 2017 |
|
||
|
Deferred tax assets: |
|
|
|
|
|
|
|
|
|
Foreign tax benefit of U.S. reserves |
|
$ |
3,853 |
|
|
$ |
3,741 |
|
|
Net operating losses |
|
|
443 |
|
|
|
529 |
|
|
Inventory |
|
|
1,155 |
|
|
|
860 |
|
|
Intangible assets and goodwill |
|
|
1,924 |
|
|
|
2,354 |
|
|
Accrued expenses and other |
|
|
4,743 |
|
|
|
1,418 |
|
|
Currency hedging |
|
|
519 |
|
|
|
— |
|
|
Total deferred tax assets |
|
|
12,637 |
|
|
|
8,902 |
|
|
Less: Valuation Allowance |
|
|
(291 |
) |
|
|
(346 |
) |
|
Net deferred tax assets |
|
|
12,346 |
|
|
|
8,556 |
|
|
Deferred tax liabilities: |
|
|
|
|
|
|
|
|
|
Depreciation |
|
|
(7,097 |
) |
|
|
(5,948 |
) |
|
Intangible assets and goodwill |
|
|
(52,543 |
) |
|
|
— |
|
|
Other |
|
|
(1,026 |
) |
|
|
(22 |
) |
|
Total deferred tax liabilities |
|
|
(60,666 |
) |
|
|
(5,970 |
) |
|
Net deferred tax (liabilities) assets |
|
$ |
(48,320 |
) |
|
$ |
2,586 |
|
A valuation allowance to reduce the deferred tax assets reported is required if, based on the weight of the evidence, it is more likely than not that some portion or all of the deferred tax assets will not be realized. For the fiscal years ended 2018 and 2017 management has determined that no material valuation allowances were required.
The Company prescribes a recognition threshold and measurement attribute for an uncertain tax position taken or expected to be taken in a tax return.
84
The following is a roll-forward of the Company’s unrecognized tax benefits:
|
Unrecognized tax benefits - January 2, 2016 |
|
$ |
2,049 |
|
|
Increases from positions taken during prior periods |
|
|
157 |
|
|
Settled positions and reclassifications |
|
|
1,295 |
|
|
Lapse of statute of limitations |
|
|
— |
|
|
Unrecognized tax benefits - December 31, 2016 |
|
$ |
3,501 |
|
|
Increases from positions taken during prior periods |
|
|
1,525 |
|
|
Increases from positions taken during current period |
|
|
558 |
|
|
Settled positions |
|
|
— |
|
|
Lapse of statute of limitations |
|
|
(1,042 |
) |
|
Unrecognized tax benefits - December 30, 2017 |
|
$ |
4,542 |
|
|
Increases from positions taken during prior periods |
|
|
372 |
|
|
Increases from positions taken during current period |
|
|
2,036 |
|
|
Settled positions |
|
|
— |
|
|
Lapse of statute of limitations |
|
|
(837 |
) |
|
Unrecognized tax benefits - December 29, 2018 |
|
$ |
6,113 |
|
At December 29, 2018, the Company had an unrecognized tax benefit of $6,113 including accrued interest. If recognized, the unrecognized tax benefit would have a favorable effect on the effective tax rate in future periods. The Company recognizes interest and penalties related to income tax matters in income tax expense. Interest related to the unrecognized tax benefit has been recognized and included in income tax expense. Interest accrued as of December 29, 2018, is not considered material to the Company’s consolidated financial statements. Of the $2,036 recorded by the Company for increases from positions taken during the current period, $1,784 was related to entries recorded through purchase accounting and therefore did not impact current period tax expense.
The Company files U.S. federal income tax returns as well as income tax returns in various states and foreign jurisdictions. The Company is no longer subject to income tax examinations by tax authorities for years prior to 2008 for the majority of tax jurisdictions.
The Company’s U.S. federal returns are not currently under examination by the Internal Revenue Service (IRS); Florida returns are under examination for tax years 2015 and 2016. Faster’s pre-acquisition 2016 Italian return is also under examination. To date, there have not been any significant proposed adjustments that have not been accounted for in the Company’s consolidated financial statements. Audit outcomes and the timing of audit settlements are subject to significant uncertainty. It is reasonably possible that within the next twelve months the Company will resolve some or all of the matters presently under consideration by the Florida Department of Revenue and that there could be significant increases or decreases to unrecognized tax benefits.
The Company's 2011 Equity Incentive Plan (“2011 Plan”) provides for the grant of up to an aggregate of 1,000,000 shares of restricted stock, restricted share units, stock appreciation rights, dividend or dividend equivalent rights, stock awards and other awards valued in whole or in part by reference to or otherwise based on the Company’s common stock, to officers, employees and directors of the Company. The 2011 Plan was approved by the Company’s shareholders at the 2012 Annual Meeting. As of December 29, 2018, 361,298 shares remained available to be issued through the 2011 Plan. Compensation cost is measured at the date of the grant and is recognized in earnings over the period in which the shares vest. Restricted stock expense for the twelve months ended December 29, 2018, December 30, 2017, and December 31, 2016, totaled $2,728, $2,376 and $3,676, respectively.
85
The following table summarizes restricted stock activity for the years ended December 29, 2018, December 30, 2017, and December 31, 2016:
|
|
|
Number of shares (in thousands) |
|
|
Weighted average grant-date fair value |
|
||
|
Nonvested balance at January 2, 2016 |
|
|
164 |
|
|
$ |
33.54 |
|
|
Granted |
|
|
45 |
|
|
|
33.22 |
|
|
Vested |
|
|
(100 |
) |
|
|
34.63 |
|
|
Forfeited |
|
|
(5 |
) |
|
|
33.10 |
|
|
Nonvested balance at December 31, 2016 |
|
|
104 |
|
|
$ |
32.42 |
|
|
Granted |
|
|
74 |
|
|
|
35.45 |
|
|
Vested |
|
|
(84 |
) |
|
|
32.97 |
|
|
Forfeited |
|
|
(6 |
) |
|
|
32.60 |
|
|
Nonvested balance at December 30, 2017 |
|
|
88 |
|
|
$ |
34.44 |
|
|
Granted |
|
|
111 |
|
|
|
53.55 |
|
|
Vested |
|
|
(37 |
) |
|
|
33.54 |
|
|
Forfeited |
|
|
(16 |
) |
|
|
39.62 |
|
|
Nonvested balance at December 29, 2018 |
|
|
146 |
|
|
$ |
48.66 |
|
The Company had $4,789 of total unrecognized compensation cost related to restricted stock awards granted under the 2011 Plan as of December 29, 2018. That cost is expected to be recognized over a weighted average period of 1.77 years.
The Company maintains an Employee Stock Purchase Plan (“ESPP”) in which the U.S. employees of Helios, Sun Hydraulics and Enovation Controls are eligible to participate. Employees in the United States who choose to participate are granted an opportunity to purchase common stock at 85 percent of market value on the first or last day of the quarterly purchase period, whichever is lower. Employees in the United Kingdom, under a separate plan, are granted an opportunity to purchase common stock at market value, on the first or last day of the quarterly purchase period, whichever is lower, with the Company issuing one additional free share of common stock for each six shares purchased by the employee under the ESPP. The ESPP authorizes the issuance, and the purchase by employees, of up to 1,096,875 shares of common stock through payroll deductions. No U.S. employee is allowed to buy more than $25 of common stock in any year, based on the market value of the common stock at the beginning of the purchase period, and no U.K. employee is allowed to buy more than the lesser of £1.5 or 10% of his or her annual salary in any year. Employees purchased 40,714 shares at a weighted average price of $38.01, and 31,983 shares at a weighted average price of $36.20, under the ESPP during the twelve months ended December 29, 2018, and December 30, 2017, respectively. The Company recognized $324, $429 and $312 of compensation expense during the twelve months ended December 29, 2018, December 30, 2017, and December 31, 2016, respectively. At December 29, 2018, 505,595 shares remained available to be issued through the ESPP and the U.K. plan.
In March 2012, the Board of Directors adopted the Sun Hydraulics Corporation 2012 Nonemployee Director Fees Plan (the “2012 Directors Plan”), which was approved by the shareholders of the Company at its 2012 annual meeting. Under the 2012 Directors Plan, Nonemployee Directors are compensated for their Board service solely in shares of common stock. In February 2015, the Board adopted amendments to the 2012 Directors Plan, which revised the compensation for Nonemployee Directors. Each Nonemployee Director now receives an annual retainer of 2,000 shares of Common Stock. The Chairman's retainer is twice that of a regular director, and the retainer for the chairs of each Board Committee is 150% that of a regular director. In addition, each Nonemployee Director receives 250 shares of Common Stock for attendance at each Board meeting and each meeting of each committee of the Board on which he or she serves when the committee meeting is not held within one day of a meeting of the Board. In June 2015, the Company's shareholders approved the amendments to the 2012 Directors Plan.
86
The Board has the authority to change from time to time, in any manner it deems desirable or appropriate, the share compensation to be awarded to all or any one or more Nonemployee Directors, provided that, with limited exceptions, such changes are subject to prior shareholder approval. The aggregate number of shares which may be issued during any single calendar year is limited to 35,000 Shares. The 2012 Directors Plan authorizes the issuance of up to 270,000 shares of common stock. At December 29, 2018, 124,624 shares remained available for issuance under the 2012 Directors Plan. Directors were granted 24,250 and 26,000 shares for the twelve months ended December 29, 2018, and December 30, 2017, respectively. The Company recognized director stock compensation expense of $1,213, $1,240, and $831 for the twelve months ended December 29, 2018, December 30, 2017, and December 31, 2016, respectively.
14. EARNINGS PER SHARE
The following table represents the computation of basic and diluted net income per common share:
|
|
|
December 29, 2018 |
|
|
December 30, 2017 |
|
|
December 31, 2016 |
|
|||
|
Net income |
|
$ |
46,730 |
|
|
$ |
31,558 |
|
|
$ |
23,304 |
|
|
Basic and diluted weighted average shares outstanding |
|
|
31,309 |
|
|
|
27,031 |
|
|
|
26,892 |
|
|
Basic and diluted net income per common share |
|
$ |
1.49 |
|
|
$ |
1.17 |
|
|
$ |
0.87 |
|
The Company has three defined contribution retirement plans, under the provisions of Section 401(k) of the Internal Revenue Code, covering substantially all of its eligible United States employees. Employer contribution costs recognized under the retirement plans amounted to approximately $3,807, $3,290, and $1,938 during 2018, 2017, and 2016, respectively.
The Company provides supplemental pension benefits to its employees of foreign operations in addition to mandatory benefits included in local country payroll statutes. These benefits amounted to approximately $1,865, $328, and $369 during 2018, 2017, and 2016, respectively.
In the U.S., Sun Hydraulics used an Employee Stock Ownership Plan (“ESOP”) to make discretionary contributions to employees who were eligible participants in its 401(k) retirement plan. Under the ESOP, which was 100% company funded, the Company allocated common stock to each participant's account. The allocation was generally a percentage of a participant’s compensation as determined by the Board of Directors on an annual basis. There were no restrictions on the shares contributed to the ESOP which allowed participants to sell their shares within their individual 401(k) accounts. The Company does not have any repurchase obligations under the ESOP. Effective January 1, 2019, the Company terminated the ESOP feature of the 401(k) plan and replaced it with a company stock fund. The company stock fund may be used in the future for discretionary contributions.
The Company did not contribute to the ESOP during 2018. The Company contributed 16,241 shares into the ESOP in March 2017. The Company incurred retirement benefit expense under the ESOP of approximately $1,016 and $567 during 2017 and 2016, respectively. These amounts are included in the total employer contributions to the retirement plan noted above.
87
16. ACCUMULATED OTHER COMPREHENSIVE LOSS
Changes in Accumulated Other Comprehensive Loss by Component
|
|
|
Unrealized Gains and Losses on Available-for-Sale Securities |
|
|
Unrealized Gains and Losses on Derivative Instruments |
|
|
Foreign Currency Items |
|
|
Total |
|
||||
|
Balance at January 2, 2016 |
|
$ |
(1,262 |
) |
|
$ |
— |
|
|
$ |
(8,781 |
) |
|
$ |
(10,043 |
) |
|
Other comprehensive income (loss) before reclassifications |
|
|
621 |
|
|
|
— |
|
|
|
(6,661 |
) |
|
|
(6,040 |
) |
|
Amounts reclassified from accumulated other comprehensive income |
|
|
250 |
|
|
|
— |
|
|
|
— |
|
|
|
250 |
|
|
Net current period other comprehensive income (loss) |
|
|
871 |
|
|
|
— |
|
|
|
(6,661 |
) |
|
|
(5,790 |
) |
|
Balance at December 31, 2016 |
|
$ |
(391 |
) |
|
$ |
— |
|
|
$ |
(15,442 |
) |
|
$ |
(15,833 |
) |
|
Other comprehensive (loss) income before reclassifications |
|
|
(37 |
) |
|
|
— |
|
|
|
8,964 |
|
|
|
8,927 |
|
|
Amounts reclassified from accumulated other comprehensive income |
|
|
428 |
|
|
|
— |
|
|
|
— |
|
|
|
428 |
|
|
Net current period other comprehensive income |
|
|
391 |
|
|
|
— |
|
|
|
8,964 |
|
|
|
9,355 |
|
|
Balance at December 30, 2017 |
|
$ |
— |
|
|
$ |
— |
|
|
$ |
(6,478 |
) |
|
$ |
(6,478 |
) |
|
Other comprehensive loss before reclassifications |
|
|
— |
|
|
|
(2,741 |
) |
|
|
(37,466 |
) |
|
|
(40,207 |
) |
|
Amounts reclassified from accumulated other comprehensive income |
|
|
— |
|
|
|
432 |
|
|
|
— |
|
|
|
432 |
|
|
Net current period other comprehensive loss |
|
|
— |
|
|
|
(2,309 |
) |
|
|
(37,466 |
) |
|
|
(39,775 |
) |
|
Balance at December 29, 2018 |
|
$ |
— |
|
|
$ |
(2,309 |
) |
|
$ |
(43,944 |
) |
|
$ |
(46,253 |
) |
Reclassifications out of Accumulated Other Comprehensive Loss
|
Details about Accumulated Other |
Affected Line Item in the Consolidated |
For the year Ended |
|
|||||||||
|
Comprehensive Income Components |
Statements of Operations |
December 29, 2018 |
|
|
December 30, 2017 |
|
|
December 31, 2016 |
|
|||
|
Derivative financial instruments |
|
|
|
|
|
|
|
|
|
|
|
|
|
Interest rate swap |
Interest expense, net |
$ |
(547 |
) |
|
$ |
— |
|
|
$ |
— |
|
|
|
Tax benefit |
|
115 |
|
|
|
— |
|
|
|
— |
|
|
|
Net of tax |
$ |
(432 |
) |
|
$ |
— |
|
|
$ |
— |
|
|
Unrealized gains and losses on available-for-sale securities |
|
|
|
|
|
|
|
|
|
|
|
|
|
Realized gain/(loss) on sale of securities |
Miscellaneous expense, net |
$ |
— |
|
|
$ |
(459 |
) |
|
$ |
(119 |
) |
|
Other than temporary impairment |
Miscellaneous expense, net |
|
— |
|
|
|
(220 |
) |
|
|
(276 |
) |
|
|
Total before tax |
|
— |
|
|
|
(679 |
) |
|
|
(395 |
) |
|
|
Tax benefit |
|
— |
|
|
|
251 |
|
|
|
145 |
|
|
|
Net of tax |
$ |
— |
|
|
$ |
(428 |
) |
|
$ |
(250 |
) |
|
|
|
|
|
|
|
|
|
|
|
|
|
|
|
Total reclassifications for the period |
|
$ |
(432 |
) |
|
$ |
(428 |
) |
|
$ |
(250 |
) |
88
17. SEGMENT REPORTING
The Company has two reportable segments: Hydraulics and Electronics. These segments are organized primarily based on the similar nature of products offered for sale, the types of customers served and the methods of distribution and are consistent with how the segments are managed, how resources are allocated and how information is used by the chief operating decision makers.
In the Hydraulics segment, Sun Hydraulics provides the global capital goods industries with hydraulic components and systems used to transmit power and control force, speed and motion. On a component level, Sun designs and manufactures screw-in hydraulic cartridge valves, manifolds, and integrated fluid power packages and subsystems used in hydraulic systems. The Hydraulics segment also includes the results of Faster subsequent to its acquisition on April 5, 2018, and the results of Custom Fluidpower subsequent to its acquisition on August 1, 2018. On a component level, Faster designs and manufactures quick release couplings, multi connections and casting solutions for all hydraulics applications at medium, high and extremely high pressures. Custom Fluidpower is a supplier of hydraulics, pneumatic, filtration and lubrication products and offers complete system design, installation and commissioning, and service and repairs.
In the Electronics segment, Enovation Controls designs and manufactures electronic control, display and instrumentation solutions for recreational and off-highway vehicles and stationary and power generation equipment. Product categories include traditional mechanical and electronic gauge instrumentation; plug and go CAN-based instruments; after-market support through global distribution; complete, custom panel and console offerings; engineering and application specialists; 3D solid modeling; proprietary hardware and software development and wiring harness design and manufacturing.
The Company evaluates performance and allocates resources based primarily on segment operating income. Certain costs were not allocated to the business segments as they are not used in evaluating the results of, or in allocating resources to the Company’s segments. These costs are presented in the Corporate and other line item below. For the year ended December 29, 2018, the unallocated costs included certain corporate costs not deemed to be allocable to either business segment of $438, acquisition related costs including Faster and Custom Fluidpower transaction costs of $5,450, charges related to inventory step-up to fair value of $4,441, and amortization of acquisition-related intangible assets of $23,021. The accounting policies of the Company’s operating segments are the same as those used to prepare the accompanying consolidated financial statements.
89
The following table presents financial information by reportable segment:
|
|
|
2018 |
|
|
2017 |
|
|
2016 |
|
|||
|
Net sales: |
|
|
|
|
|
|
|
|
|
|
|
|
|
Hydraulics |
|
$ |
381,845 |
|
|
$ |
230,662 |
|
|
$ |
189,523 |
|
|
Electronics |
|
|
126,200 |
|
|
|
112,177 |
|
|
|
7,411 |
|
|
|
|
$ |
508,045 |
|
|
$ |
342,839 |
|
|
$ |
196,934 |
|
|
Operating income: |
|
|
|
|
|
|
|
|
|
|
|
|
|
Hydraulics |
|
$ |
83,858 |
|
|
$ |
54,934 |
|
|
$ |
39,134 |
|
|
Electronics |
|
|
25,046 |
|
|
|
17,943 |
|
|
|
(627 |
) |
|
Corporate and other |
|
|
(33,350 |
) |
|
|
(11,386 |
) |
|
|
(4,048 |
) |
|
|
|
$ |
75,554 |
|
|
$ |
61,491 |
|
|
$ |
34,459 |
|
|
Capital expenditures: |
|
|
|
|
|
|
|
|
|
|
|
|
|
Hydraulics |
|
$ |
25,782 |
|
|
$ |
8,140 |
|
|
$ |
5,898 |
|
|
Electronics |
|
|
2,598 |
|
|
|
14,065 |
|
|
|
289 |
|
|
|
|
$ |
28,380 |
|
|
$ |
22,205 |
|
|
$ |
6,187 |
|
|
Total assets: |
|
|
|
|
|
|
|
|
|
|
|
|
|
Hydraulics |
|
$ |
771,409 |
|
|
$ |
185,300 |
|
|
$ |
193,722 |
|
|
Electronics |
|
|
263,412 |
|
|
|
274,466 |
|
|
|
251,055 |
|
|
Corporate |
|
|
7,344 |
|
|
|
— |
|
|
|
— |
|
|
|
|
$ |
1,042,165 |
|
|
$ |
459,766 |
|
|
$ |
444,777 |
|
Geographic Region Information:
Net sales are measured based on the geographic destination of sales. Tangible long-lived assets are shown based on the physical location of the assets and primarily include net property, plant and equipment:
|
|
|
2018 |
|
|
2017 |
|
|
2016 |
|
|||
|
Net sales |
|
|
|
|
|
|
|
|
|
|
|
|
|
Americas |
|
$ |
257,684 |
|
|
$ |
198,922 |
|
|
$ |
94,816 |
|
|
Europe/Middle East/Africa |
|
|
139,776 |
|
|
|
76,988 |
|
|
|
58,720 |
|
|
Asia/Pacific |
|
|
110,585 |
|
|
|
66,929 |
|
|
|
43,398 |
|
|
Total |
|
$ |
508,045 |
|
|
$ |
342,839 |
|
|
$ |
196,934 |
|
|
|
|
|
|
|
|
|
|
|
|
|
|
|
|
Tangible long-lived assets |
|
|
|
|
|
|
|
|
|
|
|
|
|
Americas |
|
$ |
83,664 |
|
|
$ |
78,429 |
|
|
$ |
71,802 |
|
|
Europe/Middle East/Africa |
|
|
26,724 |
|
|
|
7,803 |
|
|
|
7,116 |
|
|
Asia/Pacific |
|
|
16,480 |
|
|
|
5,699 |
|
|
|
1,597 |
|
|
Total |
|
$ |
126,868 |
|
|
$ |
91,931 |
|
|
$ |
80,515 |
|
18. RELATED PARTY TRANSACTIONS
Enovation Controls purchases and sells inventory to an entity partially owned by one of its officers. For the years ended December 29, 2018, December 30, 2017 and December 31, 2016, inventory sales to the entity totaled $2,584, $2,507 and $214, respectively, and inventory purchases from the entity totaled $6,178, $11,050 and $533, respectively.
90
In addition to these inventory transactions, Enovation Controls entered into a transition service agreement with the related party to provide, and receive, certain transition services for a period of up to one year for specified services. For the years ended December 29, 2018 and December 30, 2017, sales, and related costs incurred, recognized by Enovation Controls under the agreement both totaled $39 and $1,757, respectively, and are included in miscellaneous expense, net in the Consolidated Statement of Operations. For the years ended December 29, 2018 and December 30, 2017, purchases from the related party under the agreement totaled $22 and $1,160, respectively.
At December 29, 2018 and December 30, 2017, total amounts due from the entity totaled $296 and $186, respectively, and total amounts due to the entity totaled $631 and $727, respectively.
19. COMMITMENTS AND CONTINGENCIES
Legal Proceedings
The Company is not a party to any legal proceedings other than routine litigation incidental to its business. In the opinion of management, the amount of ultimate liability with respect to these actions will not materially affect the results of operations, financial position or cash flows of the Company.
Operating Leases
The Company leases manufacturing facilities, production support facilities and office space in various locations around the world. Total rental expense under these leases for the 2018, 2017 and 2016 years was approximately $2,751, $1,197 and $584, respectively. The following table summarizes the future minimum lease payments under operating leases that have initial or remaining non-cancelable lease terms in excess of one year as of December 29, 2018:
|
2019 |
|
$ |
3,094 |
|
|
2020 |
|
|
2,618 |
|
|
2021 |
|
|
2,350 |
|
|
2022 |
|
|
650 |
|
|
2023 |
|
|
139 |
|
|
Thereafter |
|
|
— |
|
|
Total minimum lease payments |
|
$ |
8,851 |
|
Insurance
The Company accrues for certain health care benefit costs under a self-funded plan and records a liability for all unresolved claims at the anticipated cost to the Company at the end of the period based on management’s assessment. The Company believes it has adequate reserves for all self-insured claims.
91
20. UNAUDITED QUARTERLY FINANCIAL INFORMATION
Quarterly Results of Operations
|
|
|
For the quarter ended |
|
|||||||||||||
|
|
|
Dec 29, |
|
|
Sept 29, |
|
|
Jun 30, |
|
|
Mar 30, |
|
||||
|
|
|
2018 |
|
|
2018 |
|
|
2018 |
|
|
2018 |
|
||||
|
Net sales |
|
$ |
138,722 |
|
|
$ |
135,837 |
|
|
$ |
136,168 |
|
|
$ |
97,318 |
|
|
Gross profit |
|
|
52,927 |
|
|
|
51,735 |
|
|
|
50,404 |
|
|
|
37,617 |
|
|
Operating income |
|
|
22,052 |
|
|
|
19,246 |
|
|
|
17,003 |
|
|
|
17,253 |
|
|
Income before income taxes |
|
|
17,032 |
|
|
|
14,250 |
|
|
|
9,220 |
|
|
|
15,893 |
|
|
Net income |
|
|
16,424 |
|
|
|
11,599 |
|
|
|
6,796 |
|
|
|
11,911 |
|
|
Basic and diluted net income per common share |
|
$ |
0.51 |
|
|
$ |
0.36 |
|
|
$ |
0.22 |
|
|
$ |
0.40 |
|
|
|
|
For the quarter ended |
|
|||||||||||||
|
|
|
Dec 30, |
|
|
Sept 30 |
|
|
Jul 1, |
|
|
Apr 1, |
|
||||
|
|
|
2017 |
|
|
2017 |
|
|
2017 |
|
|
2017 |
|
||||
|
Net sales |
|
$ |
84,150 |
|
|
$ |
88,001 |
|
|
$ |
89,335 |
|
|
$ |
81,353 |
|
|
Gross profit |
|
|
28,854 |
|
|
|
36,294 |
|
|
|
38,583 |
|
|
|
32,794 |
|
|
Operating income |
|
|
7,604 |
|
|
|
17,402 |
|
|
|
20,701 |
|
|
|
15,784 |
|
|
Income before income taxes |
|
|
5,523 |
|
|
|
15,978 |
|
|
|
10,904 |
|
|
|
15,139 |
|
|
Net income |
|
|
2,768 |
|
|
|
11,295 |
|
|
|
7,284 |
|
|
|
10,211 |
|
|
Basic and diluted net income per common share |
|
$ |
0.10 |
|
|
$ |
0.42 |
|
|
$ |
0.27 |
|
|
$ |
0.38 |
|
92
ITEM 9. CHANGES IN AND DISAGREEMENTS WITH
ACCOUNTANTS ON ACCOUNTING AND FINANCIAL DISCLOSURE
None.
ITEM 9A. CONTROLS AND PROCEDURES
Disclosure Controls and Procedures
The Company’s management, with the participation of the Chief Executive Officer and Chief Financial Officer, after evaluating the effectiveness of the Company’s “disclosure controls and procedures” (as defined in Rules 13a-15(e) and 15d-15(e) under the Securities Exchange Act of 1934, as amended, the “Exchange Act”) as of the end of the period covered by this report, have concluded that our disclosure controls and procedures are effective and are designed to ensure that the information we are required to disclose is recorded, processed, summarized and reported within the necessary time periods. Our disclosure controls and procedures include, without limitation, controls and procedures designed to ensure that information required to be disclosed by us in reports that we file or submit pursuant to the Exchange Act, is accumulated and communicated to our management, including our Chief Executive Officer and Chief Financial Officer, as appropriate to allow timely decisions regarding required disclosure.
Management’s Report on Internal Control over Financial Reporting
Management of the Company is responsible for establishing and maintaining adequate internal control over financial reporting, as such term is defined in Exchange Act Rule 13a-15(f). The Company’s internal control over financial reporting is a process designed to provide reasonable assurance regarding the reliability of financial reporting and the preparation of financial statements for external purposes in accordance with generally accepted accounting principles. Internal control over financial reporting includes those policies and procedures that:
|
|
• |
pertain to the maintenance of records that, in reasonable detail, accurately and fairly reflect the transactions and dispositions of the assets of the Company; |
|
|
• |
provide reasonable assurance that transactions are recorded, as necessary, to permit preparation of financial statements in accordance with generally accepted accounting principles, and that receipts and expenditures of the Company are being made only in accordance with authorizations of management and directors of the Company; and |
|
|
• |
provide reasonable assurance regarding prevention or timely detection of unauthorized acquisition, use or disposition of the Company’s assets that could have a material effect on the financial statements. |
Because of its inherent limitations, internal control over financial reporting may not prevent or detect misstatements. Management, with the participation of the Chief Executive Officer and Chief Financial Officer, conducted an evaluation of the effectiveness of the Company’s internal control over financial reporting based on the criteria set forth in Internal Control - Integrated Framework (2013) issued by the Committee of Sponsoring Organizations of the Treadway Commission. Based on this evaluation under the Internal Control - Integrated Framework, management, with the participation of the Chief Executive Officer and Chief Financial Officer, concluded that the internal control over financial reporting was effective as of December 29, 2018. We acquired Faster S.r.l. and Custom Fluidpower Pty Ltd on April 5, 2018 and August 1, 2018, respectively. Management excluded Faster and Custom Fluidpower from its assessment of the effectiveness of our internal control over financial reporting as of December 29, 2018, as we are currently integrating policies, processes, people and technology for the combined companies. Management will continue to evaluate our internal control over financial reporting as we execute our integration activities.
93
Changes in Internal Control Over Financial Reporting
There were no changes in the Company’s internal control over financial reporting during the year ended December 29, 2018, that materially affected, or are reasonably likely to materially affect, the Company’s internal control over financial reporting.
Attestation Report of Independent Registered Public Accounting Firm
Grant Thornton LLP, our independent registered public accounting firm, has issued an attestation report on our internal control over financial reporting. This report appears on page 56.
None.
94
ITEM 10. DIRECTORS, EXECUTIVE OFFICERS OF THE REGISTRANT AND CORPORATE GOVERNANCE MATTERS
Executive Officers
The information required by this item with respect to our executive officers is set forth in our 2019 Proxy Statement under the caption "Governance of the Company" and is incorporated herein by reference.
Directors
The information required by this item with respect to our board of directors and committees thereof is set forth in our 2019 Proxy Statement under the caption "Governance of the Company" and is incorporated herein by reference.
Section 16(a) Beneficial Ownership Reporting Compliance
The information required by this item with respect to Section 16(a) beneficial ownership reporting compliance is set forth in our 2019 Proxy Statement under the caption "Compliance with Section 16(a) of the Securities Exchange Act of 1934" and is incorporated herein by reference.
Code of Business Conduct and Ethics
The information required by this item with respect to our Code of Business Conduct and Ethics is set forth in our 2019 Proxy Statement under the caption "Governance of the Company" and is incorporated herein by reference.
ITEM 11. EXECUTIVE COMPENSATION
The information required by this item is set forth under the caption “Executive Compensation" in our 2019 Proxy Statement and is incorporated herein by reference.
ITEM 12. SECURITY OWNERSHIP OF CERTAIN
BENEFICIAL OWNERS AND MANAGEMENT AND RELATED STOCKHOLDER MATTERS
The information required by this item with respect to equity compensation plans is set forth under the caption "Equity Compensation Plan Information" in our 2019 Proxy Statement and with respect to security ownership of certain beneficial owners, directors and executive officers is set forth under the caption "Security Ownership of Certain Beneficial Owners and Management" in our 2019 Proxy Statement and is incorporated herein by reference.
ITEM 13. CERTAIN RELATIONSHIPS, RELATED TRANSACTIONS AND DIRECTOR INDEPENDENCE
The information required by this item is set forth under the captions "Compensation Committee Interlocks and Insider Participation," "Certain Relationships and Related Transactions" and “Independence and Committees of the Board of Directors" in our 2019 Proxy Statement and is incorporated herein by reference.
ITEM 14. PRINCIPAL ACCOUNTANT FEES AND SERVICES
The information required by this item is set forth under the caption “Independent Registered Public Accounting Firm" in our 2019 Proxy Statement and is incorporated herein by reference.
95
ITEM 15. EXHIBITS AND FINANCIAL STATEMENT SCHEDULES
|
|
|
Page |
|
1. The following financial statements are included in Part II, Item 8: |
|
|
|
|
|
|
|
|
55 |
|
|
|
|
|
|
Consolidated Balance Sheets as of December 29, 2018 and December 30, 2017 |
|
58 |
|
|
|
|
|
|
59 |
|
|
|
|
|
|
|
60 |
|
|
|
|
|
|
|
61 |
|
|
|
|
|
|
|
62 |
|
|
|
|
|
|
|
64 |
All other schedules are omitted as the required information is inapplicable or the information is presented in the consolidated financial statements and notes thereto in Item 8 above.
96
ITEM 16. FORM 10-K SUMMARY
None.
97
2. Exhibits:
|
Exhibit Number |
|
Exhibit Description |
|
|
|
|
|
|
||
|
|
|
|
|
|
||
|
|
|
|
|
|
||
|
|
|
|
|
|
||
|
|
|
|
|
|
||
|
|
|
|
|
|
||
|
|
|
|
|
|
||
|
|
|
|
|
|
||
|
|
|
|
|
|
||
|
|
|
|
|
|
||
|
|
|
|
|
|
||
|
|
|
|
|
|
||
|
|
|
|
|
|
||
|
|
|
|
|
|
||
|
|
|
|
|
|
||
|
|
|
|
|
|
||
|
|
|
|
|
|
||
|
|
|
|
|
|
||
|
|
|
|
|
|
||
|
|
|
|
|
|
||
|
|
|
|
|
|
||
|
|
|
|
|
|
||
|
|
|
|
|
|
||
|
|
|
|
|
|
||
|
|
|
|
|
|
||
|
|
|
|
|
|
||
|
|
|
|
|
|
||
|
|
|
|
|
|
||
|
|
|
|
|
|
||
|
|
|
|
|
|
||
|
|
|
|
|
|
||
|
|
|
|
|
|
||
|
|
|
|
|
|
||
|
|
|
|
|
|
||
|
|
|
|
|
|
||
|
|
|
|
|
|
CEO Certification pursuant to Section 302 of the Sarbanes-Oxley Act of 2002. |
|
|
|
|
|
|
|
CFO Certification pursuant to Section 302 of the Sarbanes-Oxley Act of 2002. |
|
|
|
|
|
|
|
||
|
|
|
|
|
|
||
|
|
|
|
|
101.INS |
|
XBRL Instance Document |
|
|
|
|
|
101.SCH |
|
XBRL Schema Document |
|
|
|
|
|
101.CAL |
|
XBRL Calculation Linkbase Document |
|
|
|
|
|
101.DEF |
|
XBRL Definition Linkbase Document |
|
|
|
|
|
101.LAB |
|
XBRL Label Linkbase Document |
|
|
|
|
|
101.PRE |
|
XBRL Presentation Linkbase Document |
|
+ |
Executive management contract or compensatory plan or arrangement. |
98
Pursuant to the requirements of Section 13 or 15(d) of the Securities Exchange Act of 1934, the Registrant has duly caused this Report to be signed on its behalf by the undersigned, thereunto duly authorized, in the City of Sarasota, State of Florida on February 26, 2019.
|
|
|
SUN HYDRAULICS CORPORATION |
||
|
|
|
|
|
|
|
|
|
By: |
|
/s/ Wolfgang H. Dangel |
|
|
|
|
|
Wolfgang H. Dangel, President and Chief Executive Officer |
Pursuant to requirements of the Securities Exchange Act of 1934, this Report has been signed by the following persons on behalf of the Registrant and in the capacities indicated as of February 26, 2019.
|
Signature |
|
Title |
|
|
|
|
|
/s/ Wolfgang H. Dangel |
|
|
|
Wolfgang H. Dangel |
|
President, Chief Executive Officer and Director |
|
|
|
|
|
/s/ Tricia L. Fulton |
|
|
|
Tricia L. Fulton |
|
Chief Financial Officer (Principal Financial and Accounting Officer) |
|
|
|
|
|
/s/ Marc Bertoneche |
|
|
|
Marc Bertoneche |
|
Director |
|
|
|
|
|
/s/ David W. Grzelak |
|
|
|
David Grzelak |
|
Director |
|
|
|
|
|
/s/ Christine L. Koski |
|
|
|
Christine L. Koski |
|
Director |
|
|
|
|
|
/s/ Philippe Lemaitre |
|
|
|
Philippe Lemaitre |
|
Director, Chairman of the Board of Directors |
|
|
|
|
|
/s/ Alexander Schuetz |
|
|
|
Alexander Schuetz |
|
Director |
|
|
|
|
|
/s/ Douglas M. Britt |
|
|
|
Douglas M. Britt |
|
Director |
99